. 2014 Mar;184(3):631-43.
doi: 10.1016/j.ajpath.2013.11.019. Epub 2014 Jan 3.

Ocular surface disease and dacryoadenitis in aging C57BL/6 mice

Affiliations

Ocular surface disease and dacryoadenitis in aging C57BL/6 mice

Andrew J McClellan et al. Am J Pathol. 2014 Mar.

Abstract

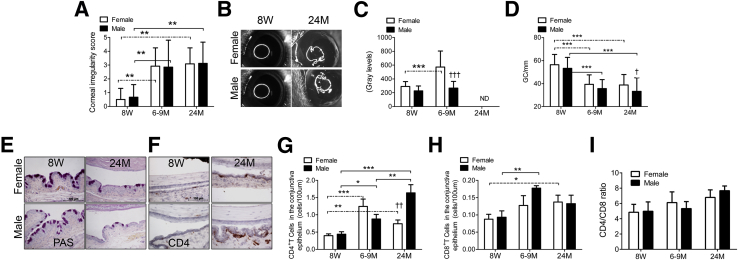
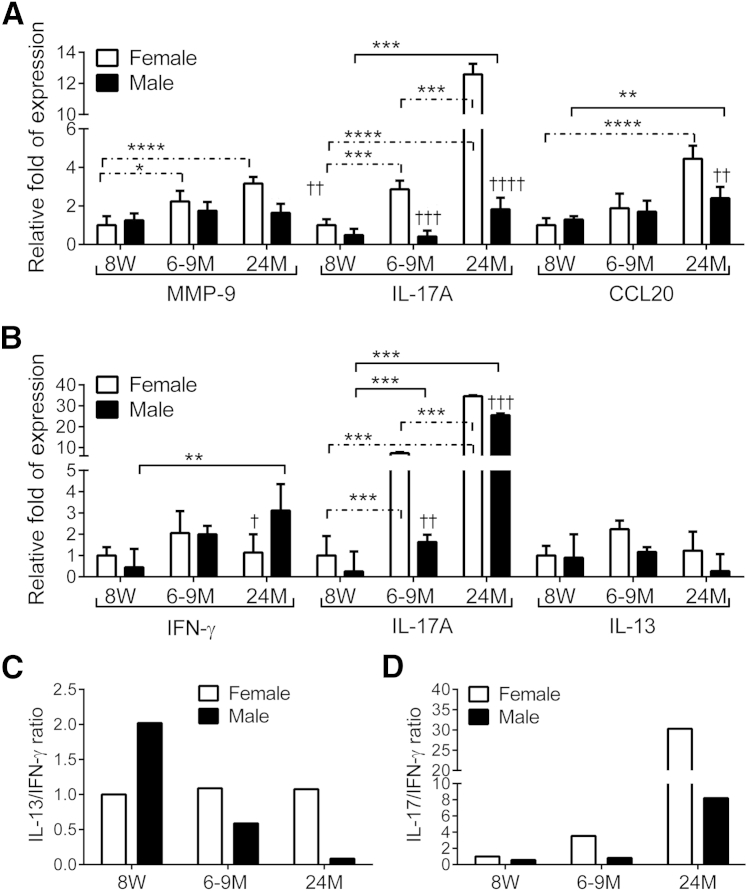
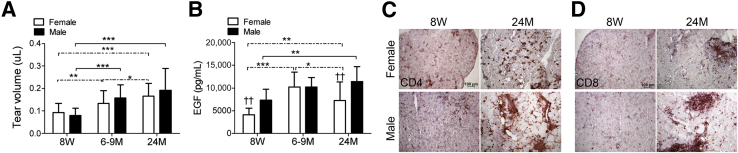
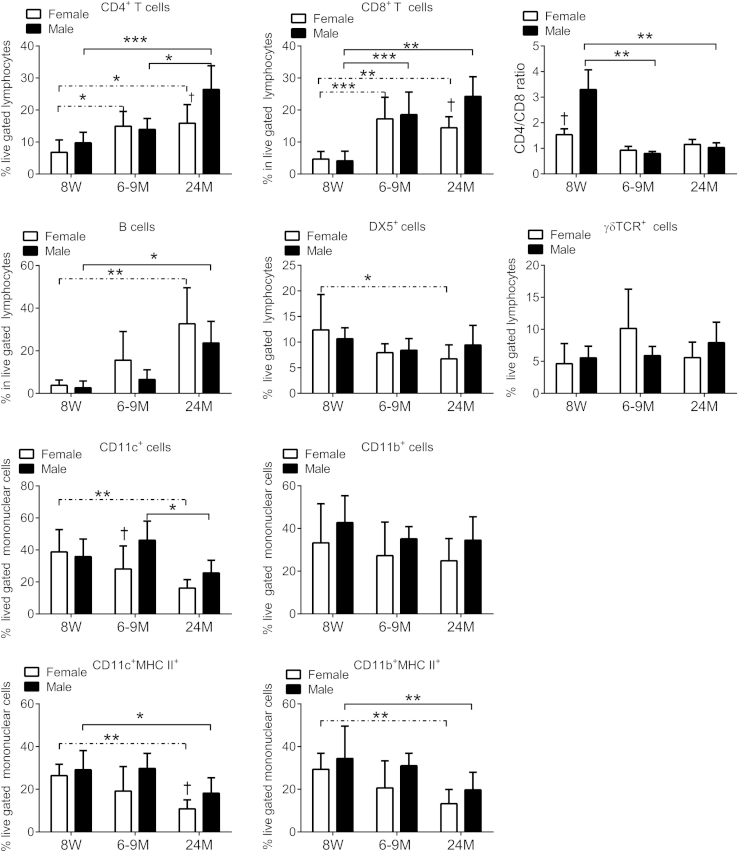
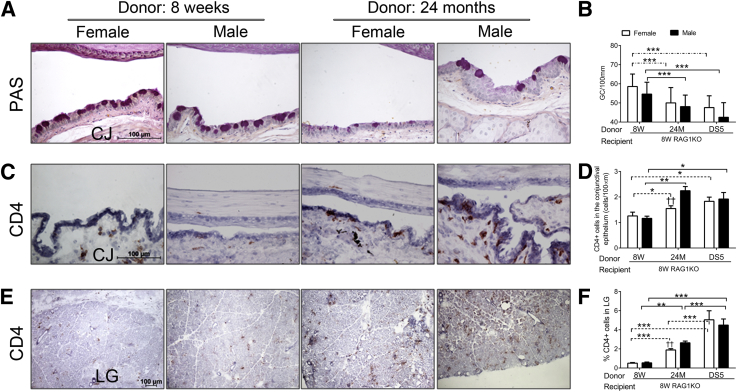
Dry eye in humans displays increased prevalence in the aged and in women. Here, we investigated the ocular surfaces and lacrimal glands of aged mice of both sexes. We surveyed three different ages [young, middle-aged (6 to 9 months), and elderly] by investigating severity markers of dry eye disease (DED). We observed an age-dependent dry eye phenotype as early as 6 to 9 months: increased corneal surface irregularity, increased corneal barrier disruption, conjunctival CD4(+) T-cell infiltration, and loss of mucin-filled goblet cells. Expression of interferon-γ, IL-17 mRNA transcripts was increased in the conjunctiva and IL-17A, matrix metallopeptidase 9, and chemokine ligand 20 in the corneas of elderly mice. Elderly male mice develop more of a skewed response of type 1 T helper cell, whereas female mice have a bias toward type 17 T helper cell in the conjunctiva. In the lacrimal gland, an increase in CD4(+) and CD8(+) T cells and B cells and a decrease in activated dendritic cells were observed. Adoptive transfer of CD4(+) T cells isolated from elderly mice transferred DED into young immunodeficient recipients, which was more pronounced from male donors. Our findings show the development of DED in aging mice. Pathogenic CD4(+) T cells that develop with aging are capable of transferring DED from older mice to naive immunodeficient recipients. Taken together, our results indicate that age-related autoimmunity contributes to development of DED with aging.


Figures

Figure 1
Figure 1
Ocular surface phenotype in young (8 weeks), middle-aged (6 to 9 months), and elderly (24 months) C57BL/6 mice. A: Corneal irregularity score. Bar graphs show means ± SD of three independent experiments with four animals per experiment (8 eyes per experiment, yielding a final sample of 24 eyes per age/sex). B: Representative corneal rings used to generate the graph in A. C: Corneal Oregon-Green dextran fluorescence intensity score. Bar graphs show means ± SD of three independent experiments with four animals per experiment (8 eyes per experiment, yielding a final sample of 24 eyes per age/sex). D: Number of PAS+ conjunctival goblet cells counted in paraffin-embedded sections expressed as number per millimeter. Bar graphs show means ± SD of two independent experiments with two to three animals per age and sex, yielding a final sample of five right eyes for each group). Both eyes/animals were independently evaluated, and results were averaged. E: Representative images of conjunctiva sections stained with PAS used to generate the bar graph in D. F: Representative images of conjunctiva frozen sections immunostained for CD4 (in red) used to generate the bar graph in G. G: CD4+ T cells infiltrating the conjunctival epithelium. H: CD8+ T cells infiltrating the conjunctival epithelium. Both CD4 and CD8 evaluation, bar graphs show means ± SD of two independent experiments with two to three animals per age and sex, yielding a final sample of five left eyes for each group). I: CD4/CD8 ratio in conjunctiva epithelium. P < 0.05, ∗∗P < 0.01, and ∗∗∗P < 0.001 for within strain comparison; ††P < 0.01, and †††P < 0.001 for sex comparison. Original magnification: ×40 (E and G). Scale bars: 100 μm (D and G). ND, not determined; 8W, 8 weeks; 6-9M, 6 to 9 months; 24M, 24 months. Dashed lines indicate female-to-female comparison; solid lines indicate male-to-male comparisons.
Figure 2
Figure 2
Aging induces expression of T-cell–related cytokines in cornea and conjunctiva. A: Relative fold of expression of MMP-9, IL-17A, and CCL20 mRNA in cornea. Bar graphs show means ± SD of one representative experiment with six samples per age and sex (experiment was repeated twice with similar results). One sample consisted of pooled right and left corneas of the same animal. B: Relative fold expression changes in IFN-γ, IL-17A, and IL-13 mRNA in conjunctiva. Bar graphs show means ± SD of one representative experiment with six samples per age and sex (experiment was repeated twice with similar results). One sample consisted of pooled right and left corneas of the same animal. C: IL-17/IFN-γ ratio in conjunctiva. D: IL-13/IFN-γ ratio in conjunctiva. P < 0.05, ∗∗P < 0.01, ∗∗∗P < 0.001, and ∗∗∗∗P < 0.0001 for within strain comparison; P < 0.01, †††P < 0.001, and ††††P < 0.0001 for sex comparison. CCL20, chemokine ligand 20; IFN-γ, interferon γ; MMP-9, matrix metallopeptidase 9; 8W, 8 weeks; 6–9M, 6 to 9 months; 24M, 24 months. Dashed lines indicate female-to-female comparison; solid lines indicate male-to-male comparisons.
Figure 3
Figure 3
Lacrimal gland evaluation in young (8 weeks), middle-aged (6 to 9 months), and old (24 months) C57BL/6 mice. A and B: Tear volume (A; means ± SD) and tear EGF concentrations (B) were measured by enzyme linked immunosorbent assay. Tear washings from both right and left eyes from one mouse per age and sex were collected and pooled into a single tube, yielding a final sample of 12 individual samples per group and age divided into three independent experiments with four samples per experiment). Bar graphs show the means ± SD. C and D: Representative images of lacrimal gland frozen sections immunostained for CD4 (in red, C) and CD8 (in red, D). P < 0.05, ∗∗P < 0.01, and ∗∗∗P < 0.001 for within strain comparison; ††P < 0.01 for sex comparison. Original magnification: ×40 (C and D). EGF, epidermal growth factor; 8W, 8 weeks; 6-9M, 6 to 9 months; 24M, 24 months. Dashed lines indicate female-to-female comparison; solid lines indicate male-to-male comparisons.
Figure 4
Figure 4
Flow cytometric analysis of LG in young (8 weeks), middle-aged (6 to 9 months), and old (24 months) C57BL/6 mice. Right and left extraorbital LGs from one mouse per group and sex were excised and pooled into a single tube, yielding a final sample of 12 individual LG samples per group and age divided into three independent experiments with four samples per experiment). Bar graphs show means ± SD. P < 0.05, ∗∗P < 0.01, and ∗∗∗P < 0.001 for within strain comparison; P < 0.05 for sex comparison. LG, lacrimal gland; MHC, major histocompatibility complex; TCR, T-cell receptor; 8W, 8 weeks; 6-9M, 6 to 9 months; 24M, 24 months. Dashed lines indicate female-to-female comparison; solid lines indicate male-to-male comparisons.
Figure 5
Figure 5
Results of adoptive of CD4+ T cells from young (8 weeks), middle-aged (6 to 9 months), and old (24 months) C57BL/6 mice to 8-week-old RAG1KO recipients. Mice subjected to DS for 5 days were used as positive controls. A: Representative images of conjunctiva sections stained with PAS used to generate the bar graph in B. B: Number of PAS+ conjunctival goblet cells counted in paraffin-embedded sections expressed as number per millimeter. Bar graphs show the means ± SD of two independent experiments with two to three animals per age and sex, yielding a final sample of five right eyes per age and sex). Both eyes/animals were independently evaluated, and results were averaged. C: Representative images of conjunctiva frozen sections immunostained for CD4 (in red) used to generate the bar graph in D. D: CD4+ T cells infiltrating the conjunctival epithelium. Bar graphs show the means ± SD of two independent experiments with two to three animals per age and sex, yielding a final sample of five right eyes for each group). Both eyes/animals were independently evaluated, and results were averaged. E: Representative images of LG frozen sections immunostained for CD4 (in red) used to generate the bar graph in F. F: CD4+ T cells in the LG. Bar graphs show means ± SD of two independent experiments with two to three animals per age and sex, yielding a final sample of five individual left LGs per group and age). P < 0.05, ∗∗P < 0.01, and ∗∗∗P < 0.001 for within strain comparison. ††P < 0.01 for sex comparison. Original magnification: ×40 (A, C, and E). CJ, conjunctiva; DS, desiccating stress; DS5, desiccating stress for 5 days; LG, lacrimal gland; RAG1KO, recombination activating gene-1 knockout; 8W, 8 weeks; 6-9M, 6 to 9 months; 24M, 24 months. Dashed lines indicate female-to-female comparison; solid lines indicate male-to-male comparisons.

References

    1. De Benedictis G., Carrieri G., Varcasia O., BonaFe M., Franceschi C. Inherited variability of the mitochondrial genome and successful aging in humans. Ann N Y Acad Sci. 2000;908:208–218. - PubMed
    1. Goronzy J.J., Weyand C.M. Aging, autoimmunity and arthritis: T-cell senescence and contraction of T-cell repertoire diversity - catalysts of autoimmunity and chronic inflammation. Arthritis Res Ther. 2003;5:225–234. - PMC - PubMed
    1. Johnson S.A., Cambier J.C. Ageing, autoimmunity and arthritis: senescence of the B cell compartment - implications for humoral immunity. Arthritis Res Ther. 2004;6:131–139. - PMC - PubMed
    1. Stacy S., Krolick K.A., Infante A.J., Kraig E. Immunological memory and late onset autoimmunity. Mech Ageing Dev. 2002;123:975–985. - PubMed
    1. Bruunsgaard H., Pedersen M., Pedersen B.K. Aging and proinflammatory cytokines. Curr Opin Hematol. 2001;8:131–136. - PubMed

Publication types

MeSH terms