. 2014:5:3009.
doi: 10.1038/ncomms4009.

Structure-based mechanism for Na(+)/melibiose symport by MelB

Affiliations
Free PMC article

Structure-based mechanism for Na(+)/melibiose symport by MelB

Abdul S Ethayathulla et al. Nat Commun. 2014.
Free PMC article

Abstract

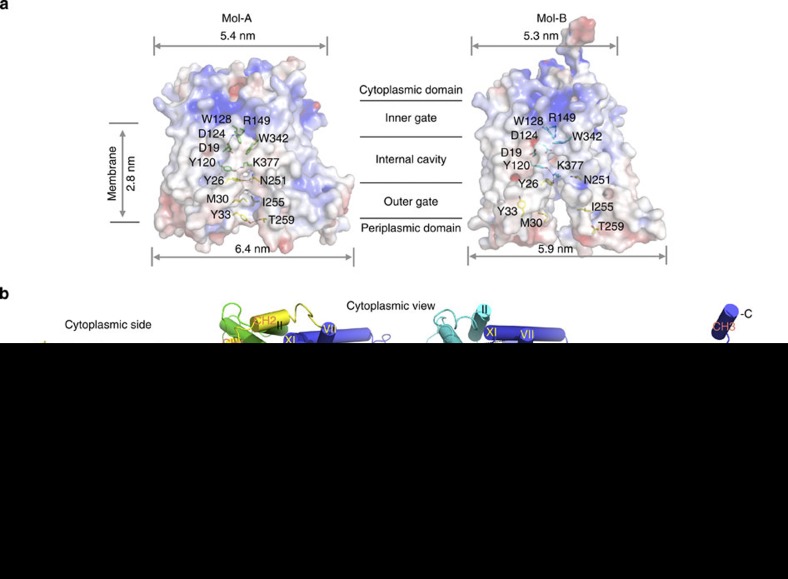
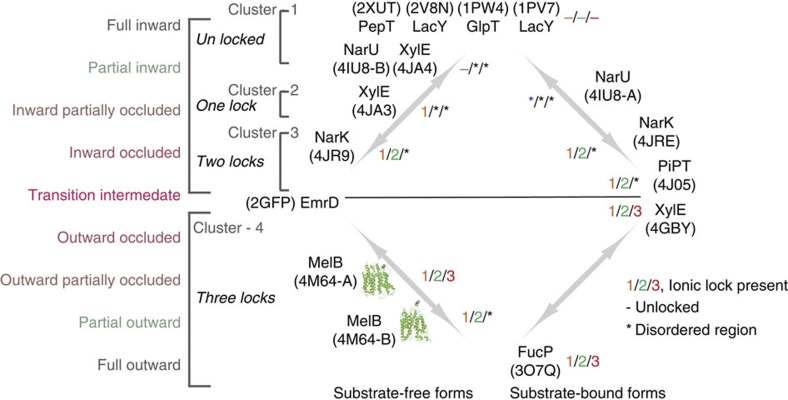
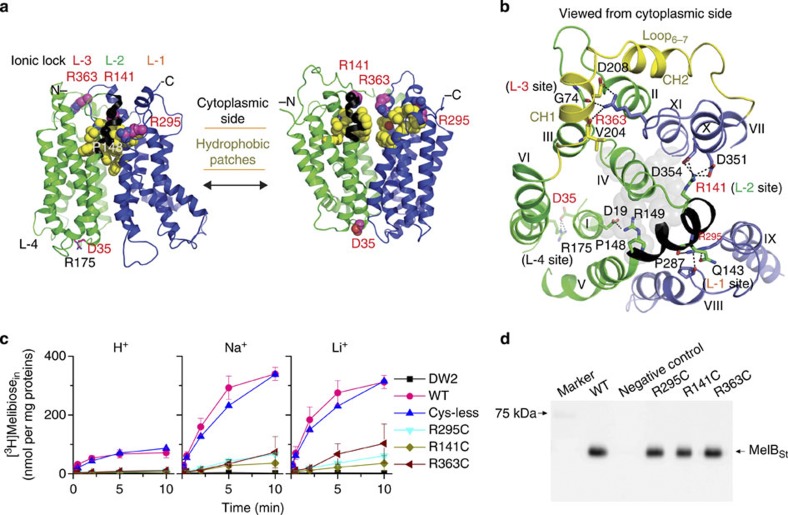
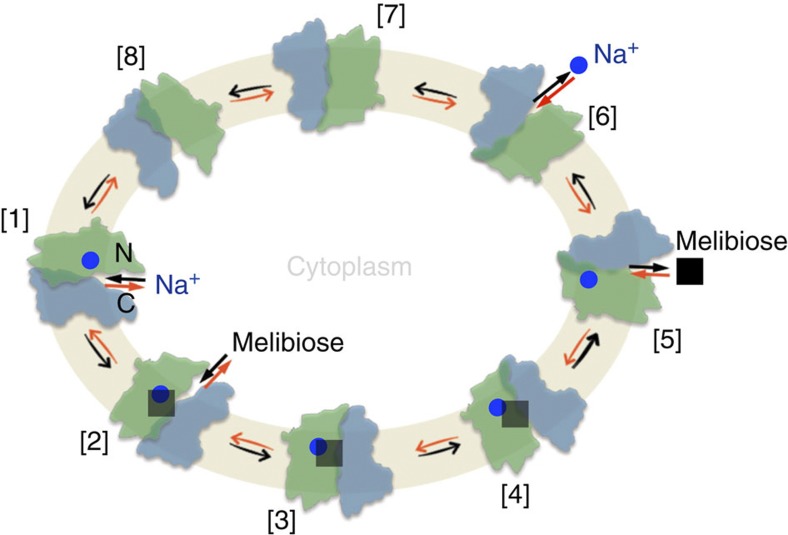
The bacterial melibiose permease (MelB) belongs to the glycoside-pentoside-hexuronide:cation symporter family, a part of the major facilitator superfamily (MFS). Structural information regarding glycoside-pentoside-hexuronide:cation symporter family transporters and other Na(+)-coupled permeases within MFS has been lacking, although a wealth of biochemical and biophysical data are available. Here we present the three-dimensional crystal structures of Salmonella typhimurium MelBSt in two conformations, representing an outward partially occluded and an outward inactive state of MelBSt. MelB adopts a typical MFS fold and contains a previously unidentified cation-binding motif. Three conserved acidic residues form a pyramidal-shaped cation-binding site for Na(+), Li(+) or H(+), which is in close proximity to the sugar-binding site. Both cosubstrate-binding sites are mainly contributed by the residues from the amino-terminal domain. These two structures and the functional data presented here provide mechanistic insights into Na(+)/melibiose symport. We also postulate a structural foundation for the conformational cycling necessary for transport catalysed by MFS permeases in general.


Figures

Figure 1
Figure 1. Functional characterization.
Purified MelBSt containing 100 mM NaCl or LiCl were subjected to D2G FRET and ITC measurements. (a) D2G FRET measurement. With an excitation wavelength of 290, emission spectra were collected between 415 and 575 nm. Difference spectra (ΔI) were calculated before and after addition of a given sugar (50 mM). Grey curves, melibiose; purple curves, methyl-β-D-thiogalactoside (TMG); green curves, sucrose; blue curves, glucose. (b) ITC measurement. Melibiose titration thermograms (insets) were recorded at 25 °C. Cumulative heat change (ΔQ) is plotted as a function of the molar ratio of melibiose/MelBSt, and fitted with the one-site independent binding model. (c) Melibiose-binding energetics. Enthalpy change (ΔH) and the association constant (Ka) were measured directly; dissociation constant Kd=1/Ka; free-energy change ΔG=−RT ln Ka; entropy change ΔTS=ΔH−ΔG; n, stoichiometry. Error bar, s.d., n=2.
Figure 2
Figure 2. Crystal structures of MelBSt in two outward conformations.
(a) Surface electropotential maps with side chains forming the outer gate and the internal cavity shown in yellow and green (Mol-A), respectively, or cyan (Mol-B) sticks. (b) Overall structure of MelBSt. The N-terminal domains of Mol-A or Mol-B are shown in green and cyan, respectively, and the central loops are shown in yellow. The helices are labelled with Roman numerals. CH1–3 denote the helices in the cytoplasmic loops and the C-terminal tail. All figures showing MelB structures were prepared by Cα1–430 superposition of Mol-B on Mol-A.
Figure 3
Figure 3. Cosubstrate-binding sites.
(a) Wall-eyed stereo view from the periplasmic side of the internal cavity in Mol-A with the N- and C-halves in green and blue, respectively. (b) Identical view of Mol-B with N- and C-halves in cyan and blue, respectively. (c) Steady-state levels of [3H]melibiose accumulation by intact cells at 10 min presented as histograms. DW2, cells without MelB. Error bar, s.e.m.; n=2 for all mutants with a single-site mutation and n=10 for the WT and DW2. (d) Trp→D2G FRET with RSO vesicles. The emission signals were collected at wavelength of 490 nm after being excited at wavelength of 290 nm. ⁁, adding 10 μM D2G; pink arrows ↓, adding 120 mM melibiose; grey arrows ↓, adding water; black arrows ↓, adding 20 mM or 50 mM Na+ or Li+. Black double-headed arrows ↔, Na+ or Li+ stimulation; pink double-headed arrows ↔, melibiose displacement of D2G.
Figure 4
Figure 4. Melibiose efflux and exchange.
RSO membrane vesicles (28 mg ml−1) containing MelBSt were tested for outwardly directed flow of [3H]melibiose in the absence (efflux, squares) or presence (exchange, red circles) of equimolar concentration of unlabelled melibiose. The same experiment was performed in the presence of 20 mM NaCl or LiCl. 2-(4′-maleimidylanilino)naphthalene-6-sulphonic acid-treated vesicles were used for the negative control (blue triangles). Acidic pH effect on melibiose efflux was tested by decreasing the dilution buffer pH to 5.5 (green squares). Error bar, s.e.m., n=2.
Figure 5
Figure 5. Clusters of MFS permeases in different conformations.
Structures were categorized into clusters according to their conformational state. *, Disordered region in structure; −, at an unlocked state; 1/2/3, the presence of lock-1, lock-2 or lock-3. PDB ID is shown for each structure.
Figure 6
Figure 6. Ionic locks and conformational cycling.
N- and C-terminal domains are shown in green and blue, respectively, and hydrophobic patches are in yellow. Arg141–Arg149 stretch is coloured as black. ‘L’ denotes positions of ionic locks. (a) Left, outward partially occluded conformation (Mol-A); right, threading model for inward conformation. (b) Residues forming ionic locks are shown in sticks connected by broken lines. Grey spheres represent the residues involved in sugar binding. (c) Cys mutant of Arg residue at position 295, 141 or 363. Intact E. coli DW2 cells containing WT MelBSt or a given mutant were assayed for [3H]melibiose transport (0.4 mM, 10 mCi mmol−1) in the absence or presence of 20 mM NaCl or LiCl. Intracellular melibiose expressed as nmol mg−1 of total proteins is plotted as a function of time. Each single-site mutation is in the WT background. Error bar, s.e.m., n=2 for the mutants and n=3 for the WT. (d) Western blotting. Twenty-five micrograms of RSO vesicles was loaded on each well and detected by anti-His-tag antibody.
Figure 7
Figure 7. Scheme for Na+/melibiose symport.
[1–8], Kinetic steps in the overall transport cycle. The green colour-filled cycle represents the cell inner membrane. Na+, blue circles; melibiose, black squares. N, the N-terminal domain in green colour; C, the C-terminal domain in blue colour. Melibiose influx down a sugar concentration gradient starts at step [6] and proceeds via the red arrows around the circle, and melibiose efflux down a sugar concentration gradient starts at [1] and proceeds via the black arrows around the circle. Active transport of melibiose against a concentration gradient proceeds from step [6] via the red arrows as the melibiose influx.

References

    1. Poolman B. et al.. Cation and sugar selectivity determinants in a novel family of transport proteins. Mol. Microbiol. 19, 911–922 (1996). - PubMed
    1. Saier M. H. Jr. Families of transmembrane sugar transport proteins. Mol. Microbiol. 35, 699–710 (2000). - PubMed
    1. Mizushima K. et al.. Cloning and sequencing of the melB gene encoding the melibiose permease of Salmonella typhimurium LT2. Mol. Gen. Genet. 234, 74–80 (1992). - PubMed
    1. Guan L., Nurva S. & Ankeshwarapu S. P. Mechanism of melibiose/cation symport of the melibiose permease of Salmonella typhimurium. J. Biol. Chem. 286, 6367–6374 (2011). - PMC - PubMed
    1. Reiling J. H. et al.. A haploid genetic screen identifies the major facilitator domain containing 2A (MFSD2A) transporter as a key mediator in the response to tunicamycin. Proc. Natl Acad. Sci. USA 108, 11756–11765 (2011). - PMC - PubMed

Publication types