. 2014 Feb 6;506(7486):97-101.
doi: 10.1038/nature12828. Epub 2013 Dec 25.

Sequence variants in SLC16A11 are a common risk factor for type 2 diabetes in Mexico

Collaborators

Sequence variants in SLC16A11 are a common risk factor for type 2 diabetes in Mexico

SIGMA Type 2 Diabetes Consortium et al. Nature. .

Abstract

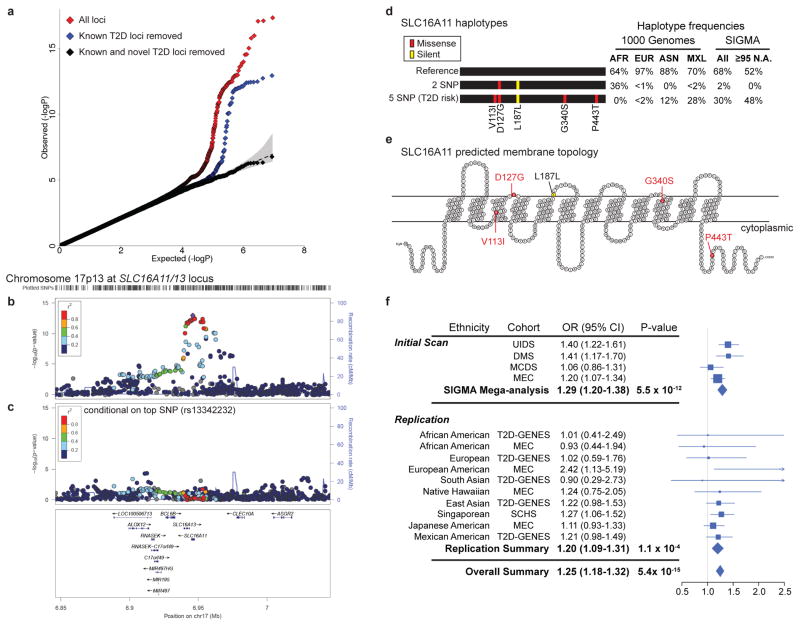
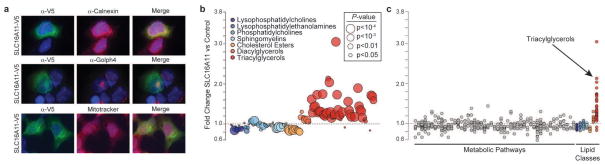
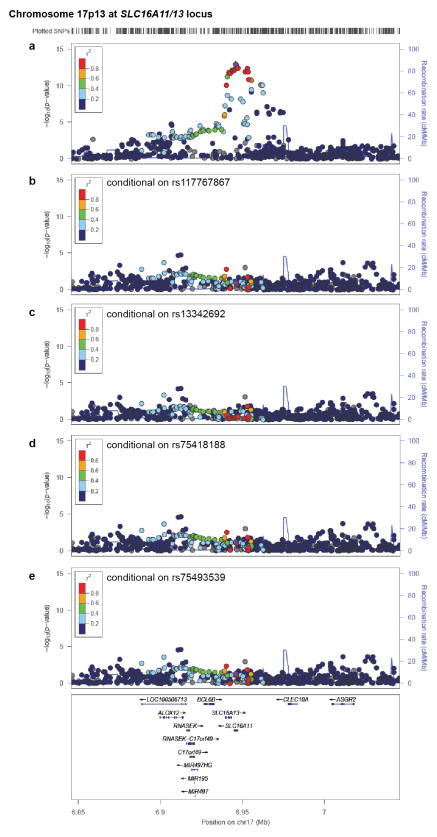
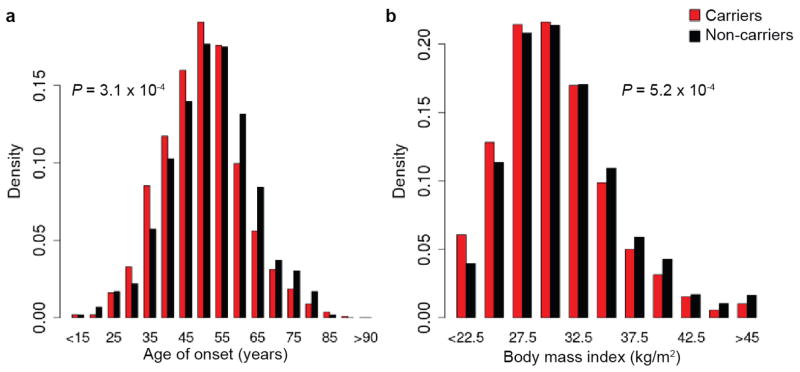
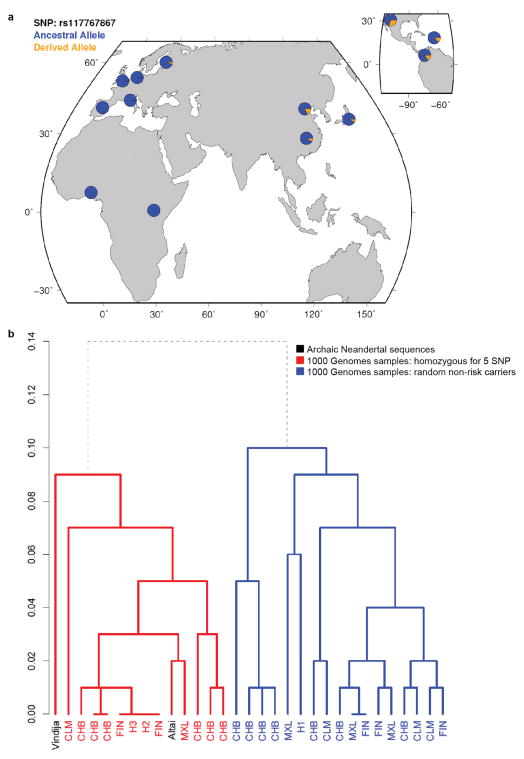
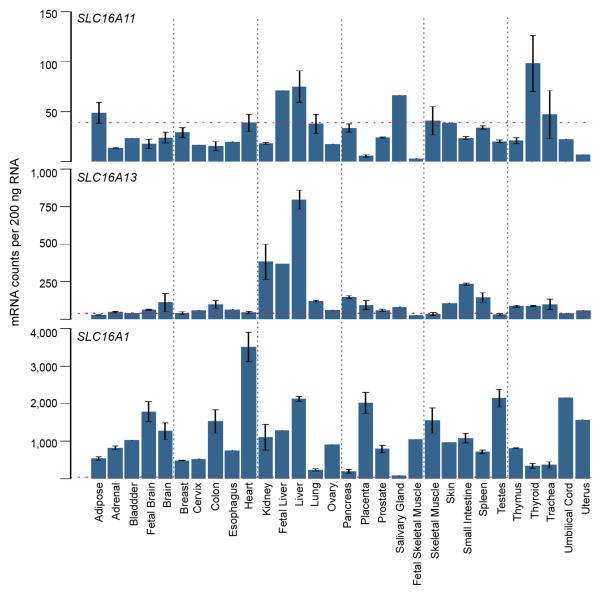
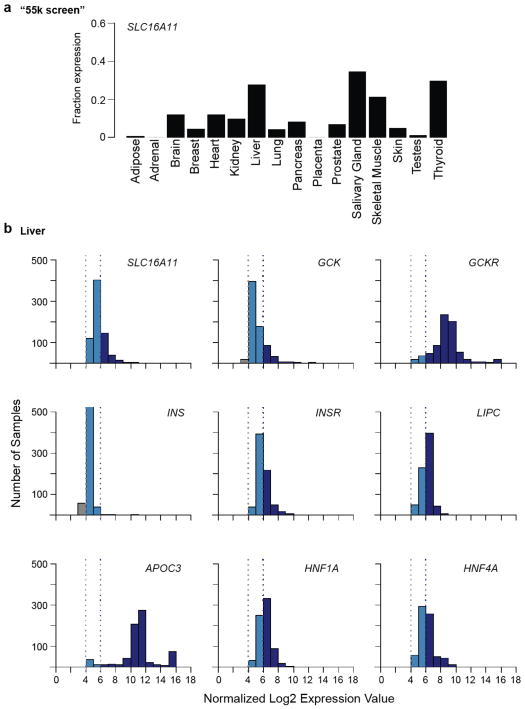
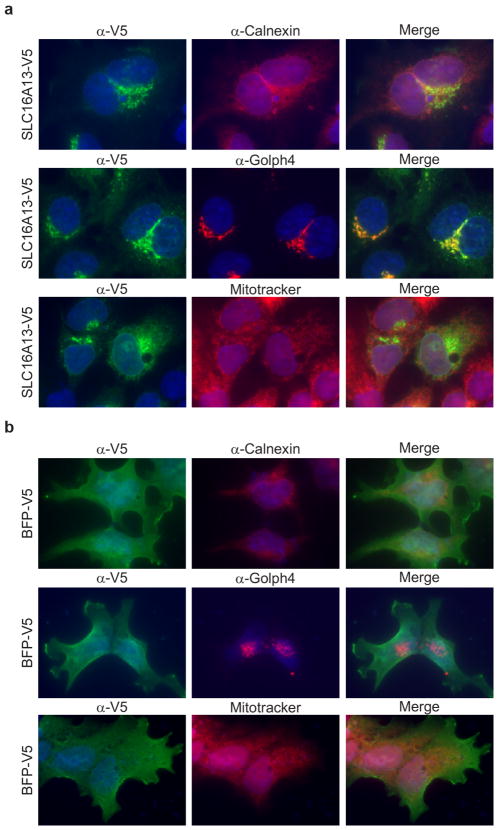
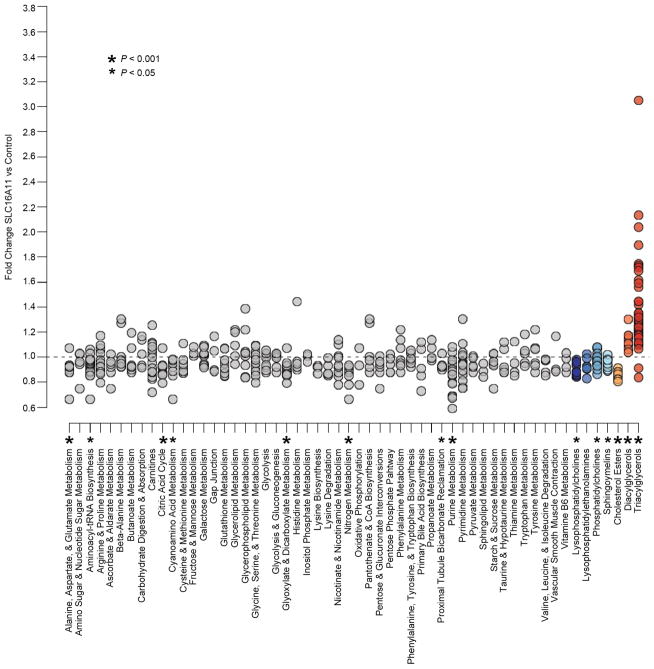
Performing genetic studies in multiple human populations can identify disease risk alleles that are common in one population but rare in others, with the potential to illuminate pathophysiology, health disparities, and the population genetic origins of disease alleles. Here we analysed 9.2 million single nucleotide polymorphisms (SNPs) in each of 8,214 Mexicans and other Latin Americans: 3,848 with type 2 diabetes and 4,366 non-diabetic controls. In addition to replicating previous findings, we identified a novel locus associated with type 2 diabetes at genome-wide significance spanning the solute carriers SLC16A11 and SLC16A13 (P = 3.9 × 10(-13); odds ratio (OR) = 1.29). The association was stronger in younger, leaner people with type 2 diabetes, and replicated in independent samples (P = 1.1 × 10(-4); OR = 1.20). The risk haplotype carries four amino acid substitutions, all in SLC16A11; it is present at ~50% frequency in Native American samples and ~10% in east Asian, but is rare in European and African samples. Analysis of an archaic genome sequence indicated that the risk haplotype introgressed into modern humans via admixture with Neanderthals. The SLC16A11 messenger RNA is expressed in liver, and V5-tagged SLC16A11 protein localizes to the endoplasmic reticulum. Expression of SLC16A11 in heterologous cells alters lipid metabolism, most notably causing an increase in intracellular triacylglycerol levels. Despite type 2 diabetes having been well studied by genome-wide association studies in other populations, analysis in Mexican and Latin American individuals identified SLC16A11 as a novel candidate gene for type 2 diabetes with a possible role in triacylglycerol metabolism.


Conflict of interest statement

The authors declare no competing financial interests.

Figures

Figure 1
Figure 1. Identification of a novel T2D risk haplotype carrying 5 SNPs in SLC16A11
(a) QQ plot of association statistics in genome-wide scan shows calibration under the null and enrichment in the tail for all SNPs (red), and after removing SNPs within 1 Mb of previously published T2D associations (blue). Removal of sites within 1 Mb of 68 known loci and two novel loci results in a null distribution (black). (b) Regional plot of association at 17p13.1 that spans SLC16A11 and SLC16A13. (c) Analysis conditional on genotype at rs13342232 (the top associated variant) reduces signal to far below genome-wide significance across the surrounding region. Color indicates r2 to the most strongly associated site; recombination rate is shown, each based on the 1,000 Genomes ASN population. (d) Graphical depictions of SLC16A11 haplotypes constructed from the synonymous and four missense SNPs associated to T2D, with haplotype frequencies derived from the 1,000 Genomes Project and SIGMA samples. AFR, Africa (n=185); EUR, European (n=379); ASN, East Asian (n=286); MXL, Mexican samples from Los Angeles (n=66). Frequencies from SIGMA samples are calculated from genotypes and represent either the entire dataset (“All”) or only samples estimated to have ≥95% Native American ancestry (“≥95 N.A.”, n=290; Supplementary Note). Haplotypes with population frequency <1% are not depicted. (e) Predicted membrane topology of human SLC16A11 generated using TMHMM 2.0 and visualized with TeXtopo. Locations of SNPs carried by the T2D-associated haplotype are indicated. (f) Forest plot depicting odds ratio estimates at rs75493593 from the four SIGMA cohorts, the SIGMA pooled mega-analysis, the replication cohorts, replication-only meta-analysis, and the overall meta-analysis (including all replication cohorts and the SIGMA mega-analysis). Accompanying table lists ethnicity, cohort names, estimated odds ratio (OR) and 95% confidence interval (95% CI). Replication cohorts are the Type 2 Diabetes Genetic Exploration by Next-generation sequencing in multi-Ethnic Samples (T2D-GENES), Multiethnic Cohort (MEC), and Singapore Chinese Health Study (SCHS). Further details provided in Supplementary Table 8.
Figure 2
Figure 2. SLC16A11 localizes to the endoplasmic reticulum and alters lipid metabolism in HeLa cells
(a) Localization of SLC16A11 to the endoplasmic reticulum. HeLa cells expressing C-terminus, V5-tagged SLC16A11 were immunostained for SLC16 expression (α-V5) along with markers for the endoplasmic reticulum (α-Calnexin), cis-Golgi apparatus (α-Golph4), or mitochondria (MitoTracker). Imaging of each protein was optimized for clarity of localization rather than comparison of expression level across proteins. (b) Changes in intracellular lipid metabolites following expression of SLC16A11-V5 in HeLa cells. The fold-change in cells expressing SLC16A11 relative to cells expressing control proteins is plotted for individual lipid metabolites, with lipid classes indicated by point color and P-values (of the Wilcox rank sum test) by point size. (c) Fold change plotted for both polar and lipid metabolites, grouped according to metabolic pathway or class. Each point within a pathway or class shows the fold-change of a single metabolite within that pathway or class. Pathway names and statistical analyses are shown in Extended Data Fig. 10 and Supplementary Table 14.
Extended Data Figure 1
Extended Data Figure 1. Principle component analysis (PCA) projection of SIGMA samples onto principal components calculated using data from samples collected by the Human Genome Diversity Project (HGDP)
PCA projection of SIGMA onto HGDP Yoruba, French, Karitiana and Han (Chinese) populations (a) before ancestry quality control filters were applied, with cohort centroids as indicated and (b) after all quality control filters were applied, with case and control centroids as indicated. Principal components 3 and 4 (c) before filtering samples on ancestry (a small number of samples in the MEC cohort show East Asian admixture) and (d) after all quality control filters were applied. Additional plots as in (b) but separating (e) cases and (f) controls.
Extended Data Figure 2
Extended Data Figure 2. Regional plot for signal at TCF7L2
Point color indicates r2 to the most strongly associated site (rs7903146) and recombination rate is also shown, both based on the 1,000 Genomes ASN population.
Extended Data Figure 3
Extended Data Figure 3. Conditional analyses reveal multiple independent signals at INS-IGF2 and KCNQ1
Regional plots are shown for the interval spanning INS-IGF2 and KCNQ1 (a) without conditioning, (b) conditional on rs2237897 at KCNQ1, (c) conditional on rs2237897 and rs139647931 (both at KCNQ1), and (d) conditional on rs2237897 and rs139647931 (both at KCNQ1) and rs11564732 (the top associated variant in the INS-IGF2-TH region). The top SNPs in 11p15.5 and KCNQ1 are ~700 kb away from each other, but despite this proximity, there is a strong residual signal of association at INS-IGF2 after analysis conditional on genotype at KCNQ1. Point color indicates r2 to rs11564732 and recombination rate is also shown, both based on the 1,000 Genomes ASN population.
Extended Data Figure 4
Extended Data Figure 4. Regional plots for SLC16A11 conditional on associated missense variants of that gene
Association signal at chromosome 17p13 (a) without conditioning, or conditional on the four missense SNPs in SLC16A11: (b) rs117767867, (c) rs13342692, (d) rs75418188, and (e) rs75493593. Point color indicates r2 to the most strongly associated SNP (rs13342232) and recombination rate is also shown, both based on the 1,000 Genomes ASN population.
Extended Data Figure 5
Extended Data Figure 5. Cases with risk haplotype develop T2D younger and at a lower BMI than non-carriers
(a) Distribution of age-of-onset in T2D cases based on genotype at rs13342232, binned every 5 years with upper bounds indicated (carriers n=1,126; non-carriers n=594). (b) Distribution of BMI in T2D cases for carriers and non-carriers of rs13342232, binned every 2.5 kg/m2 with upper bounds indicated (carriers n=2,161; non-carriers n=1,647). P-values from two-sample t-test between T2D risk haplotype carriers and T2D non-carriers.
Extended Data Figure 6
Extended Data Figure 6. Frequency distribution of the risk haplotype and dendrogram depicting clustering with Neandertal haplotypes
(a) Allele frequency of missense SNP rs117767867 (tag for risk haplotype) in the 1,000 Genomes Phase I dataset. (b) Dendrogram generated from haplotypes across the 73 kb Neandertal introgressed region. Nodes for modern human haplotypes are labeled in red or blue with the 1,000 Genomes population in which the corresponding haplotype resides. Archaic Neandertal sequences are labeled in black and include the low coverage Neandertal sequence (labeled Vindija), and the unpublished Neandertal sequence that is homozygous for the 5 SNP risk haplotype (Altai). H1 includes haplotypes from MXL and FIN, and H2 and H3 both include haplotypes from CLM, MXL, CHB, and ASW. Modern human sequences included are all 1,000 Genomes Phase I samples that are homozygous for the 5 SNP risk haplotype (n=15), and 16 non-risk haplotypes—four haplotypes (from two randomly selected individuals) from each of the CLM, MXL, CHB, and FIN 1,000 Genomes populations (the populations with carriers of the 5 SNP haplotype). The red subtree depicts the Neandertal clade, with all risk haplotypes clustering with the Altai and Vindija sequences. In blue are all other modern human haplotypes. The dendrogram was generated by the R function hclust using a complete linkage clustering algorithm on a distance matrix measuring the fraction of SNPs called in the 1000 genomes project at which a pair of haplotypes differs (the Y-axis represents this distance). Since haplotypes are unavailable for the archaic samples, we picked a random allele to compute the distance matrix.
Extended Data Figure 7
Extended Data Figure 7. Analysis of gene expression for SLC16A11, SLC16A13, and SLC16A1 in 30 human tissues
Data measured using nCounter is shown as mean, normalized mRNA counts per 200ng RNA +/− SEM. Threshold for background (non-specific) binding is indicated by the red line. Sample size for each tissue (n): pancreas (5), adipose, brain, colon, liver, skeletal muscle, and thyroid (3), adrenal, fetal brain, breast, heart, kidney, lung, placenta, prostate, small intestine, spleen, testes, thymus, and trachea (2), bladder, cervix, esophagus, fetal liver, ovary, salivary gland, fetal skeletal muscle, skin, umbilical cord, and uterus (1).
Extended Data Figure 8
Extended Data Figure 8. Microarray-based analysis of SLC16A11 expression in human tissues
(a) Results from the “55k screen”, a survey of gene expression in 55,269 samples profiled on the Affymetrix U133 plus 2.0 array, are shown as the fraction of samples of a given tissue in which SLC16A11 is expressed. Sample size for each tissue (n): adipose (394), adrenal (69), brain (1990), breast (4104), heart (178), kidney (675), liver (721), lung (1442), pancreas (150), placenta (107), prostate (578), salivary gland (26), skeletal muscle (793), skin (947), testis (102), thyroid (108). (b) Histograms show the expression level distribution of SLC16A11 and other well-studied liver genes in 721 liver samples from the “55k screen.” INS is shown as reference for a gene not expressed in liver. Based on negative controls a normalized log2 expression of 4 is considered baseline and log2 expression values greater than 6 are considered expressed.
Extended Data Figure 9
Extended Data Figure 9. SLC16A13 localizes to Golgi apparatus
HeLa cells transiently expressing C-terminus, V5-tagged (a) SLC16A13 or (b) BFP were immunostained for SLC16A13 or BFP expression (α-V5) along with specific markers for the endoplasmic reticulum (α-Calnexin), cis-Golgi apparatus (α-Golph4) and mitochondria (MitoTracker). Due to heterogeneity in expression levels of overexpressed proteins and endogenous organelle markers, imaging of each protein was optimized for clarity of localization and varied across images; therefore, images are not representative of relative expression levels of each protein as compared to the other proteins.
Extended Data Figure 10
Extended Data Figure 10. Pathway and class-based metabolic changes induced by SLC16A11 expression
Changes in metabolite levels in HeLa cells expressing SLC16A11-V5 compared to control-transfected cells are plotted in groups according to metabolic pathway or class. Pathways shown include all KEGG pathways from the human reference set for which metabolites were measured as well as eight additional classes of metabolites covering carnitines and lipid sub-types. Each point within a pathway or class shows the fold-change of a single metabolite within that pathway or class. For each pathway or class with at least six measured metabolites, enrichment was computed as described in Online Methods. Asterisks indicate pathways with P ≤ 0.05 and FDR ≤ 0.25. Supplementary Table 14 shows additional details from the enrichment analysis.

Comment in

References

    1. Rosenberg NA, et al. Genome-wide association studies in diverse populations. Nature reviews. Genetics. 2010;11:356–366. - PMC - PubMed
    1. Grant SFA, et al. Variant of transcription factor 7-like 2 (TCF7L2) gene confers risk of type 2 diabetes. Nature genetics. 2006;38:320–323. doi: http://www.nature.com/ng/journal/v38/n3/suppinfo/ng1732_S1.html. - PubMed
    1. Unoki H, et al. SNPs in KCNQ1 are associated with susceptibility to type 2 diabetes in East Asian and European populations. Nature genetics. 2008;40:1098–1102. doi: http://www.nature.com/ng/journal/v40/n9/suppinfo/ng.208_S1.html. - PubMed
    1. Yasuda K, et al. Variants in KCNQ1 are associated with susceptibility to type 2 diabetes mellitus. Nature genetics. 2008;40:1092–1097. doi: http://www.nature.com/ng/journal/v40/n9/suppinfo/ng.207_S1.html. - PubMed
    1. Villalpando S, et al. Prevalence and distribution of type 2 diabetes mellitus in Mexican adult population: a probabilistic survey. Salud Pública de México. 2010;52:S19–S26. - PubMed

Publication types

MeSH terms

Associated data