. 2014 Jan 23;505(7484):495-501.
doi: 10.1038/nature12912. Epub 2014 Jan 5.

Discovery and saturation analysis of cancer genes across 21 tumour types

Affiliations

Discovery and saturation analysis of cancer genes across 21 tumour types

Michael S Lawrence et al. Nature. .

Abstract

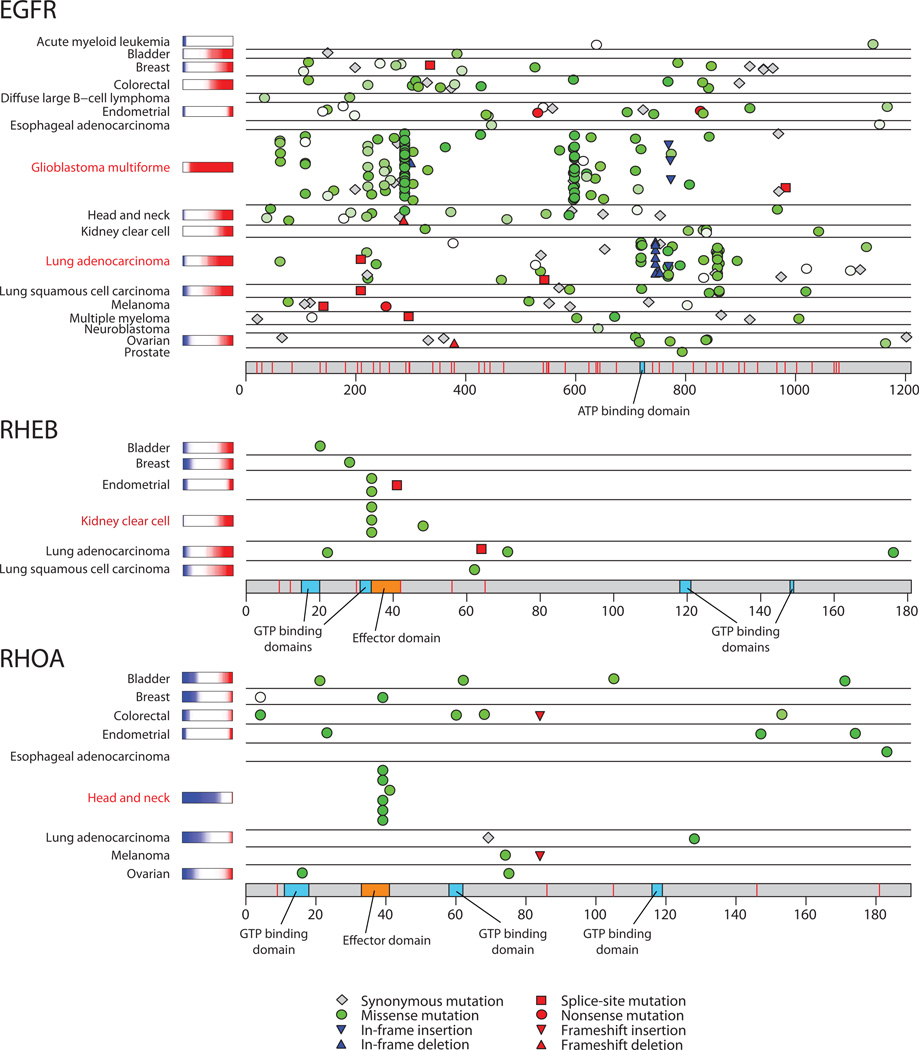
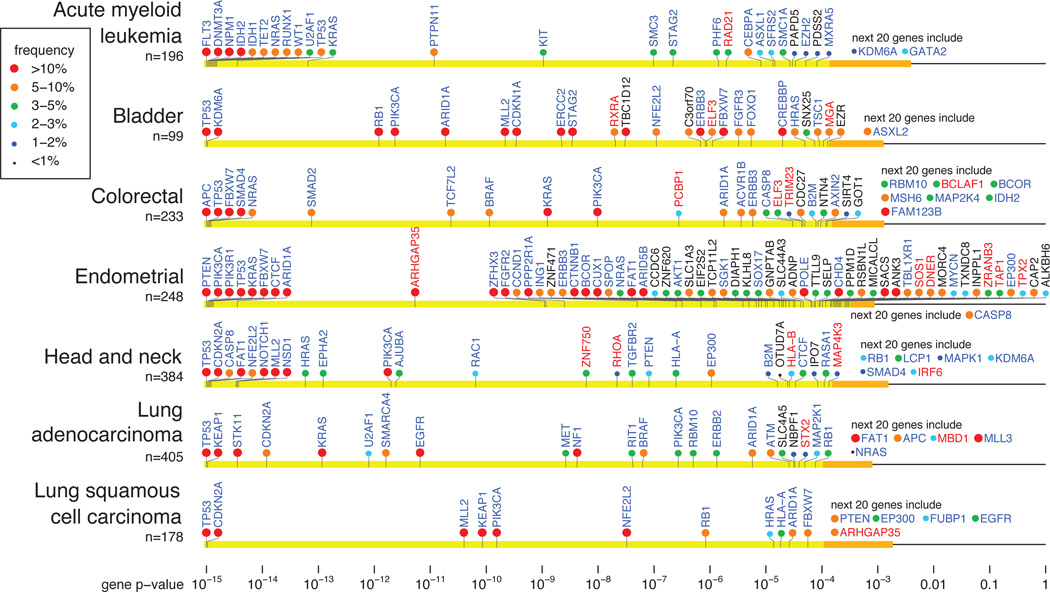
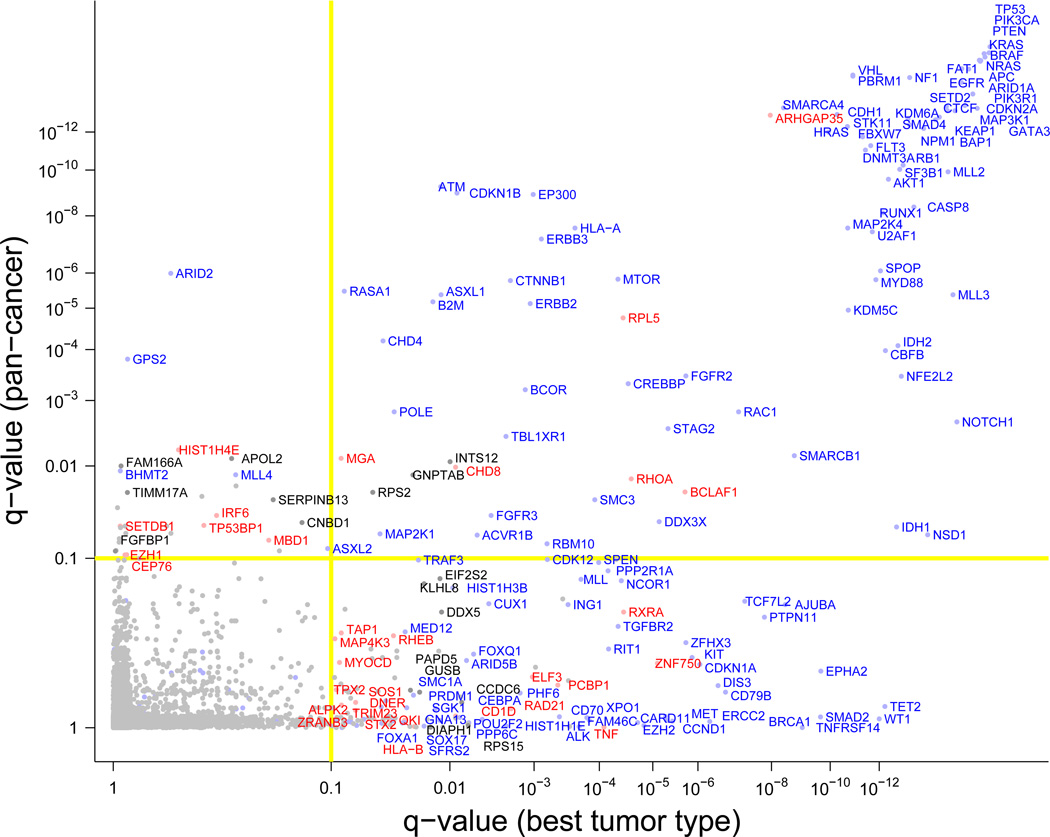
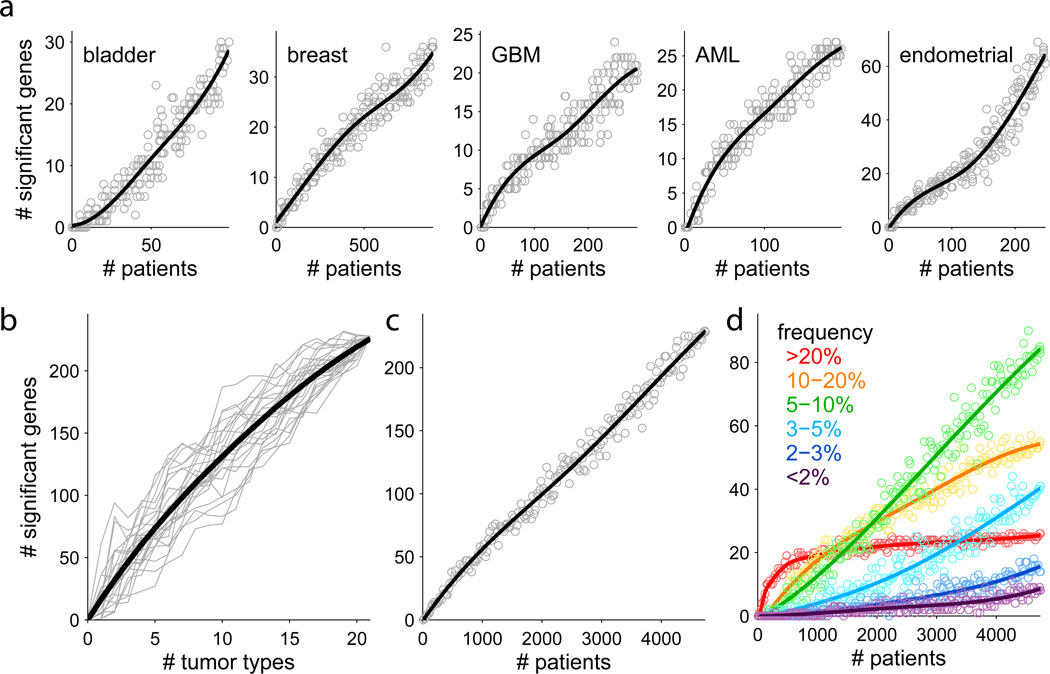
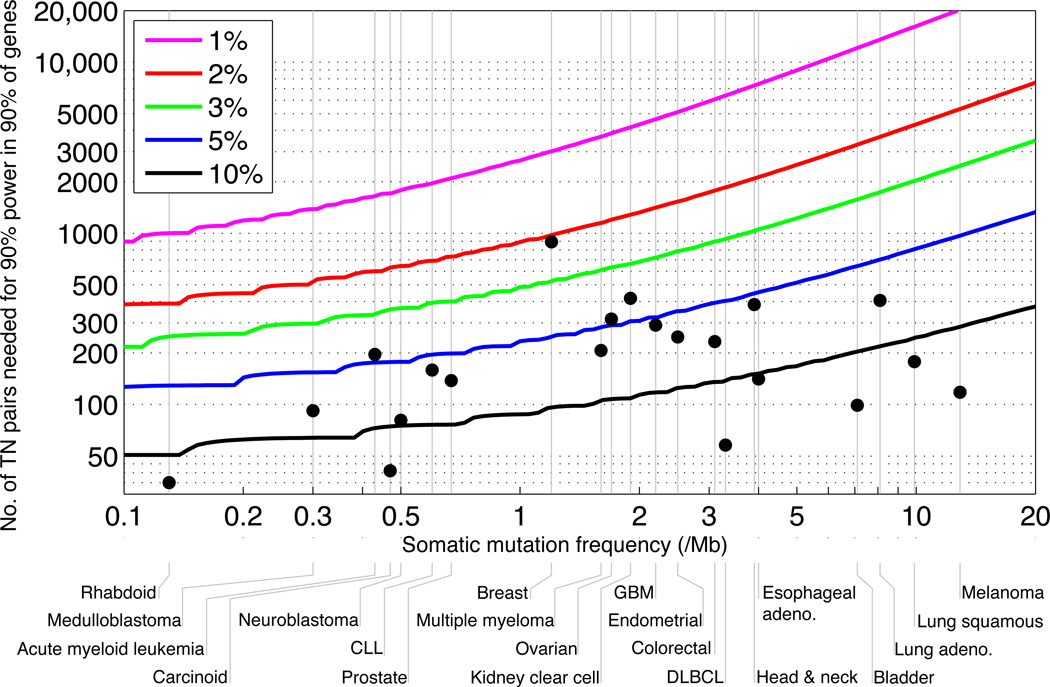
Although a few cancer genes are mutated in a high proportion of tumours of a given type (>20%), most are mutated at intermediate frequencies (2-20%). To explore the feasibility of creating a comprehensive catalogue of cancer genes, we analysed somatic point mutations in exome sequences from 4,742 human cancers and their matched normal-tissue samples across 21 cancer types. We found that large-scale genomic analysis can identify nearly all known cancer genes in these tumour types. Our analysis also identified 33 genes that were not previously known to be significantly mutated in cancer, including genes related to proliferation, apoptosis, genome stability, chromatin regulation, immune evasion, RNA processing and protein homeostasis. Down-sampling analysis indicates that larger sample sizes will reveal many more genes mutated at clinically important frequencies. We estimate that near-saturation may be achieved with 600-5,000 samples per tumour type, depending on background mutation frequency. The results may help to guide the next stage of cancer genomics.


Figures

Figure 1
Figure 1
Mutation patterns for one known and two novel cancer genes. EGFR shows distinctive tumor-type-specific concentrations of mutations in different regions of the gene. RHEB, which encodes a small GTPase in the RAS superfamily, shows a mutational hotspot in the effector domain. RHOA, another a member of the RAS superfamily, also shows a mutational hotspot in the effector domain. Colored bars after tumor type names are copy-ratio distributions for the gene, when available (red=amplified, blue=deleted). See also Supplementary Figure 4. Similar diagrams for all genes are available at http://www.tumorportal.org.
Figure 2
Figure 2
Cancer genes in selected tumor types. Genes are arranged on the horizontal line according to p-value (combined value for the three tests in MutSig). Yellow region contains genes that achieve FDR q≤0.1. Orange interval contains p-values for the next 20 genes. Gene name color indicates whether the gene is a known cancer gene (blue), a novel gene with clear connection to cancer (red; discussed in text), or an additional novel gene (black). Circle color indicates the frequency (percent of patients carrying non-silent somatic mutations) in that tumor type. See also Supplementary Figure 5.
Figure 3
Figure 3
Cancer genes identified in 4742-tumor dataset. X-axis indicates the q-value (FDR) in the most significant of the 21 tumor types. Y-axis indicates the q-value when the 4742 tumors are analyzed as a combined cohort. Genes in the upper left quadrant reached significance only in the combined analysis. Genes in the lower right quadrant reached significance only in one or more single-type analyses. Genes in the upper right quadrant were significant in both the combined set and in individual tumor types. Color of gene names is as in Figure 2.
Figure 4
Figure 4
Down-sampling analysis shows that gene discovery is continuing as samples and tumor types are added. a. Analysis within tumor types. Each point represents a random subset of patients. Blue line is a smoothed fit. b. Analysis by adding tumor types. Each grey line represents a random ordering of the 21 tumor types. c. Analysis by adding samples. Each point is a random subset of the 4742 patients. d. Analysis in panel c broken down by mutation frequency. Genes mutated at frequencies ≥ 20% are nearing saturation, while intermediate frequencies show steep growth. See also Supplementary Figures 7, 8.
Figure 5
Figure 5
Number of samples needed to detect significantly mutated genes, as a function of a tumor type’s median background mutation frequency of (x-axis) and a cancer gene’s mutation rate above background (the various curves). Y-axis shows the number of samples needed to achieve 90% power for 90% of genes. Grey vertical lines indicate tumor type median background mutation frequencies. Black dots indicate sample sizes in the current study. For most tumor types, the current sample size is inadequate to reliably detect genes mutated at 5% or less above background. See also Supplementary Figure 9.

Similar articles

  • International network of cancer genome projects.
    International Cancer Genome Consortium; Hudson TJ, Anderson W, Artez A, Barker AD, Bell C, Bernabé RR, Bhan MK, Calvo F, Eerola I, Gerhard DS, Guttmacher A, Guyer M, Hemsley FM, Jennings JL, Kerr D, Klatt P, Kolar P, Kusada J, Lane DP, Laplace F, Youyong L, Nettekoven G, Ozenberger B, Peterson J, Rao TS, Remacle J, Schafer AJ, Shibata T, Stratton MR, Vockley JG, Watanabe K, Yang H, Yuen MM, Knoppers BM, Bobrow M, Cambon-Thomsen A, Dressler LG, Dyke SO, Joly Y, Kato K, Kennedy KL, Nicolás P, Parker MJ, Rial-Sebbag E, Romeo-Casabona CM, Shaw KM, Wallace S, Wiesner GL, Zeps N, Lichter P, Biankin AV, Chabannon C, Chin L, Clément B, de Alava E, Degos F, Ferguson ML, Geary P, Hayes DN, Hudson TJ, Johns AL, Kasprzyk A, Nakagawa H, Penny R, Piris MA, Sarin R, Scarpa A, Shibata T, van de Vijver M, Futreal PA, Aburatani H, Bayés M, Botwell DD, Campbell PJ, Estivill X, Gerhard DS, Grimmond SM, Gut I, Hirst M, López-Otín C, Majumder P, Marra M, McPherson JD, Nakagawa H, Ning Z, Puente XS, Ruan Y, Shibata T, Stratton MR, Stunnenberg HG, Swerdlow H, Velculescu VE, Wilson RK, Xue HH, Yang L, Spellman PT, Bader GD, Boutros PC, Campbell PJ, Flicek P, Getz G, Guigó R, Guo G, Haussler D, Heath S, Hu… See abstract for full author list ➔ International Cancer Genome Consortium, et al. Nature. 2010 Apr 15;464(7291):993-8. doi: 10.1038/nature08987. Nature. 2010. PMID: 20393554 Free PMC article.
  • Mutational heterogeneity in cancer and the search for new cancer-associated genes.
    Lawrence MS, Stojanov P, Polak P, Kryukov GV, Cibulskis K, Sivachenko A, Carter SL, Stewart C, Mermel CH, Roberts SA, Kiezun A, Hammerman PS, McKenna A, Drier Y, Zou L, Ramos AH, Pugh TJ, Stransky N, Helman E, Kim J, Sougnez C, Ambrogio L, Nickerson E, Shefler E, Cortés ML, Auclair D, Saksena G, Voet D, Noble M, DiCara D, Lin P, Lichtenstein L, Heiman DI, Fennell T, Imielinski M, Hernandez B, Hodis E, Baca S, Dulak AM, Lohr J, Landau DA, Wu CJ, Melendez-Zajgla J, Hidalgo-Miranda A, Koren A, McCarroll SA, Mora J, Crompton B, Onofrio R, Parkin M, Winckler W, Ardlie K, Gabriel SB, Roberts CWM, Biegel JA, Stegmaier K, Bass AJ, Garraway LA, Meyerson M, Golub TR, Gordenin DA, Sunyaev S, Lander ES, Getz G. Lawrence MS, et al. Nature. 2013 Jul 11;499(7457):214-218. doi: 10.1038/nature12213. Epub 2013 Jun 16. Nature. 2013. PMID: 23770567 Free PMC article.
  • Emerging patterns of somatic mutations in cancer.
    Watson IR, Takahashi K, Futreal PA, Chin L. Watson IR, et al. Nat Rev Genet. 2013 Oct;14(10):703-18. doi: 10.1038/nrg3539. Epub 2013 Sep 11. Nat Rev Genet. 2013. PMID: 24022702 Free PMC article. Review.
  • Patterns of somatic mutation in human cancer genomes.
    Greenman C, Stephens P, Smith R, Dalgliesh GL, Hunter C, Bignell G, Davies H, Teague J, Butler A, Stevens C, Edkins S, O'Meara S, Vastrik I, Schmidt EE, Avis T, Barthorpe S, Bhamra G, Buck G, Choudhury B, Clements J, Cole J, Dicks E, Forbes S, Gray K, Halliday K, Harrison R, Hills K, Hinton J, Jenkinson A, Jones D, Menzies A, Mironenko T, Perry J, Raine K, Richardson D, Shepherd R, Small A, Tofts C, Varian J, Webb T, West S, Widaa S, Yates A, Cahill DP, Louis DN, Goldstraw P, Nicholson AG, Brasseur F, Looijenga L, Weber BL, Chiew YE, DeFazio A, Greaves MF, Green AR, Campbell P, Birney E, Easton DF, Chenevix-Trench G, Tan MH, Khoo SK, Teh BT, Yuen ST, Leung SY, Wooster R, Futreal PA, Stratton MR. Greenman C, et al. Nature. 2007 Mar 8;446(7132):153-8. doi: 10.1038/nature05610. Nature. 2007. PMID: 17344846 Free PMC article.
  • Our changing view of the genomic landscape of cancer.
    Bell DW. Bell DW. J Pathol. 2010 Jan;220(2):231-43. doi: 10.1002/path.2645. J Pathol. 2010. PMID: 19918804 Free PMC article. Review.

Cited by

References

    1. Garraway LA, Lander ES. Lessons from the cancer genome. Cell. 2013;153:17–37. - PubMed
    1. Vogelstein B, et al. Cancer genome landscapes. Science. 2013;339:1546–1558. - PMC - PubMed
    1. Imielinski M, et al. Mapping the hallmarks of lung adenocarcinoma with massively parallel sequencing. Cell. 2012;150:1107–1120. - PMC - PubMed
    1. Carter SL, et al. Absolute quantification of somatic DNA alterations in human cancer. Nat Biotechnol. 2012;30:413–421. - PMC - PubMed
    1. Cibulskis K, et al. Sensitive detection of somatic point mutations in impure and heterogeneous cancer samples. Nat Biotechnol. 2013;31:213–219. - PMC - PubMed

Publication types