Comparative Study
. 2014 Apr;42(6):e43.
doi: 10.1093/nar/gkt1325. Epub 2014 Jan 3.

Comparison and quantitative verification of mapping algorithms for whole-genome bisulfite sequencing

Affiliations
Comparative Study

Comparison and quantitative verification of mapping algorithms for whole-genome bisulfite sequencing

Govindarajan Kunde-Ramamoorthy et al. Nucleic Acids Res. 2014 Apr.

Abstract

Coupling bisulfite conversion with next-generation sequencing (Bisulfite-seq) enables genome-wide measurement of DNA methylation, but poses unique challenges for mapping. However, despite a proliferation of Bisulfite-seq mapping tools, no systematic comparison of their genomic coverage and quantitative accuracy has been reported. We sequenced bisulfite-converted DNA from two tissues from each of two healthy human adults and systematically compared five widely used Bisulfite-seq mapping algorithms: Bismark, BSMAP, Pash, BatMeth and BS Seeker. We evaluated their computational speed and genomic coverage and verified their percentage methylation estimates. With the exception of BatMeth, all mappers covered >70% of CpG sites genome-wide and yielded highly concordant estimates of percentage methylation (r(2) ≥ 0.95). Fourfold variation in mapping time was found between BSMAP (fastest) and Pash (slowest). In each library, 8-12% of genomic regions covered by Bismark and Pash were not covered by BSMAP. An experiment using simulated reads confirmed that Pash has an exceptional ability to uniquely map reads in genomic regions of structural variation. Independent verification by bisulfite pyrosequencing generally confirmed the percentage methylation estimates by the mappers. Of these algorithms, Bismark provides an attractive combination of processing speed, genomic coverage and quantitative accuracy, whereas Pash offers considerably higher genomic coverage.


Figures

Figure 1.
Figure 1.
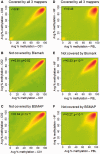
All three mappers provide excellent coverage and highly concordant estimates of CpG methylation genome-wide. (A) Percentage of CpG sites covered by Pash, Bismark and BSMAP, and the overlaps among them. Each mapping algorithm covers >80% of the CpG sites, and 78% are covered by all the three mapping algorithms. ‘Not covered by BSMAP’, for example, indicates the percentage of CpG sites that are covered by Pash and Bismark but not by BSMAP. Correlations of CpG site-specific percentage methylation calls among the different mapping algorithms are high: (B) Bismark versus Pash (r2 = 0.95), (C) BSMAP versus Pash (r2 = 0.96) and (D) BSMAP versus Bismark (r2 = 0.97). Red, yellow and green indicate high, moderate and low densities, respectively. All data are for C01-HF library only, as an example.
Figure 2.
Figure 2.
Genome-wide coverage of 200-bp bins containing ≥2 CpG sites by different mapping algorithms. (A) Percentage of bins covered by all mappers and not covered by individual mappers across all four libraries (C01-HF, C01-PBL, C02-HF and C02-PBL). More than 78% of the bins are covered by all three mappers in each library. (B) Comparing methylation across four libraries requires that each bin be covered in all four libraries. Fully 18% of bins are not covered by BSMAP in at least one library, and (C) 9% of bins are not covered by Bismark in at least one library.
Figure 3.
Figure 3.
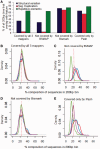
Evaluation of interindividual and tissue-specific variation of percentage methylation according to different mapping algorithms. (A–C) Correlation of percentage methylation across individuals, according to mapping category. (A) Average percentage methylation (per bin, across all mappers) is highly concordant in individual 2 (C02) versus individual 1 (C01) (r2 = 0.91). (B) For bins not covered by Bismark, interindividual correlation (r2 = 0.91) is comparable with that across all mappers (P = 0.52). [Note: Statistical significance is indicating whether the correlation shown is different from that in (A).] (C) For bins not covered by BSMAP, interindividual correlation is reduced [r2 = 0.84; significantly lower than in bins covered by all mappers (P < 10−10)]. (D–F) Correlation of percentage methylation between tissues (PBL versus HF) according to different mapping algorithms. (D) Bins covered by all mappers show substantial tissue-specific variation (r2 = 0.43). (E) For bins not covered by Bismark, inter-tissue correlation is significantly higher (r2 = 0.53, P < 10−10 relative to those covered by all mappers) [Statistical significance is indicating whether the correlation shown is different from that in (D)]. (F) For bins not covered by BSMAP, inter-tissue correlation is significantly lower (r2 = 0.27, P < 10−10 relative to those covered by all mappers).
Figure 4.
Figure 4.
Characterization of genomic regions differently covered by the three mapping algorithms (all four libraries combined). (A) Percentage of covered 200-bp bins overlapping with different genomic features, by mapper category. Compared with regions covered by all three mappers, those not covered by Bismark and covered only by Pash are highly enriched for overlap with segmental duplications and structural variations. In regions covered by all mappers (B) and in those not covered by Bismark (C), percentage nucleotide compositions are all equal. (A: red, T: blue, G: green, C: purple.) (D) Regions not covered by BSMAP are enriched for ‘T’ and depleted of ‘G’ nucleotides. (E) Regions covered only by Pash have an under-representation of ‘G’ nucleotides.
Figure 5.
Figure 5.
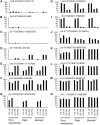
Verification of percentage methylation by quantitative bisulfite pyrosequencing in bins not covered by BSMAP. (A–C) Regions in which Bismark and Pash found low percentage methylation in all four libraries. (D–F) Regions in which Bismark and Pash found tissue-specific variation (i.e. low in HF and higher in PBL). (G–I) Regions in which Bismark and Pash found tissue-specific variation (i.e. high in HF and lower in PBL). (J–N) Regions showing medium to high percentage methylation across all four libraries. Overall, the percentage methylation measured by quantitative pyrosequencing compared favorably with the estimates obtained by Bisulfite-seq.

References

    1. Jones PA. Functions of DNA methylation: islands, start sites, gene bodies and beyond. Nat. Rev. Genet. 2012;13:484–492. - PubMed
    1. Clark SJ, Harrison J, Paul CL, Frommer M. High sensitivity mapping of methylated cytosines. Nucleic Acids Res. 1994;22:2990–2997. - PMC - PubMed
    1. Lister R, Pelizzola M, Dowen RH, Hawkins RD, Hon G, Tonti-Filippini J, Nery JR, Lee L, Ye Z, Ngo QM, et al. Human DNA methylomes at base resolution show widespread epigenomic differences. Nature. 2009;462:315–322. - PMC - PubMed
    1. Meissner A, Mikkelsen TS, Gu H, Wernig M, Hanna J, Sivachenko A, Zhang X, Bernstein BE, Nusbaum C, Jaffe DB, et al. Genome-scale DNA methylation maps of pluripotent and differentiated cells. Nature. 2008;454:766–770. - PMC - PubMed
    1. Seisenberger S, Andrews S, Krueger F, Arand J, Walter J, Santos F, Popp C, Thienpont B, Dean W, Reik W. The dynamics of genome-wide DNA methylation reprogramming in mouse primordial germ cells. Mol. Cell. 2012;48:849–862. - PMC - PubMed

Publication types

Associated data