

Distribution and diel vertical movements of mesopelagic scattering layers in the Red Sea
- PMID: 24391275
- PMCID: PMC3873044
- DOI: 10.1007/s00227-012-1973-y
Distribution and diel vertical movements of mesopelagic scattering layers in the Red Sea
Abstract
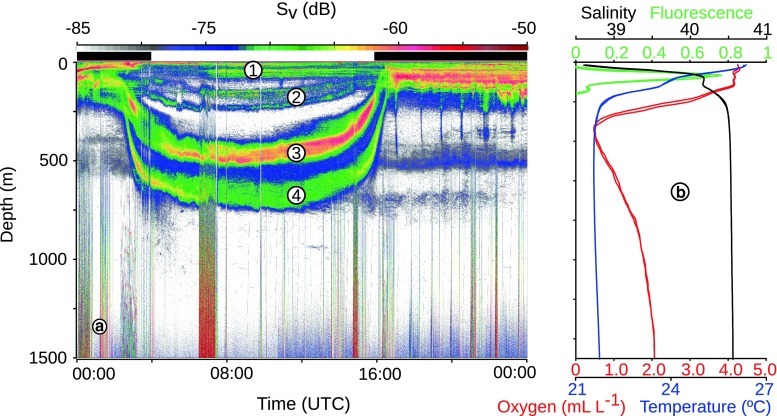
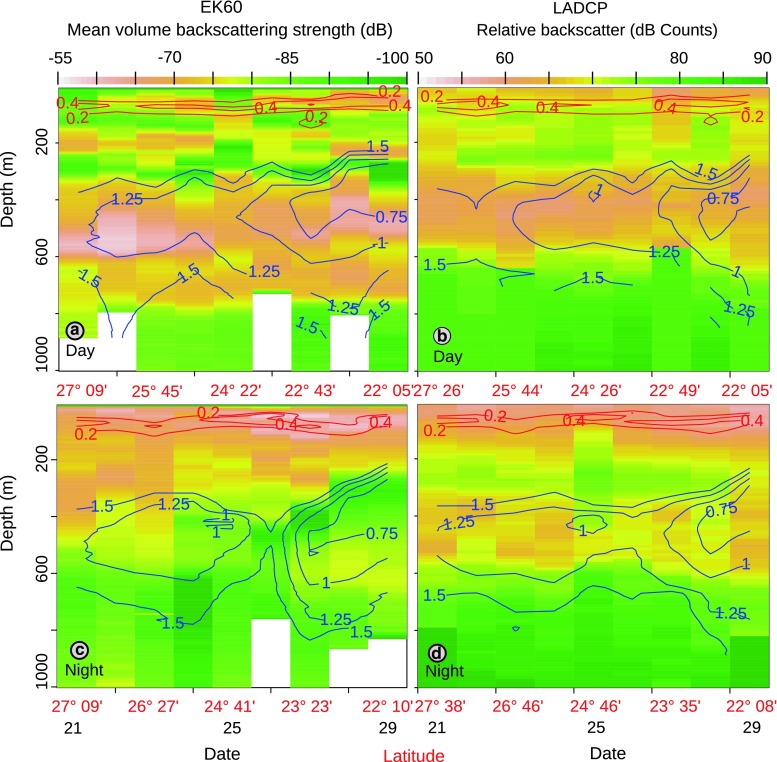
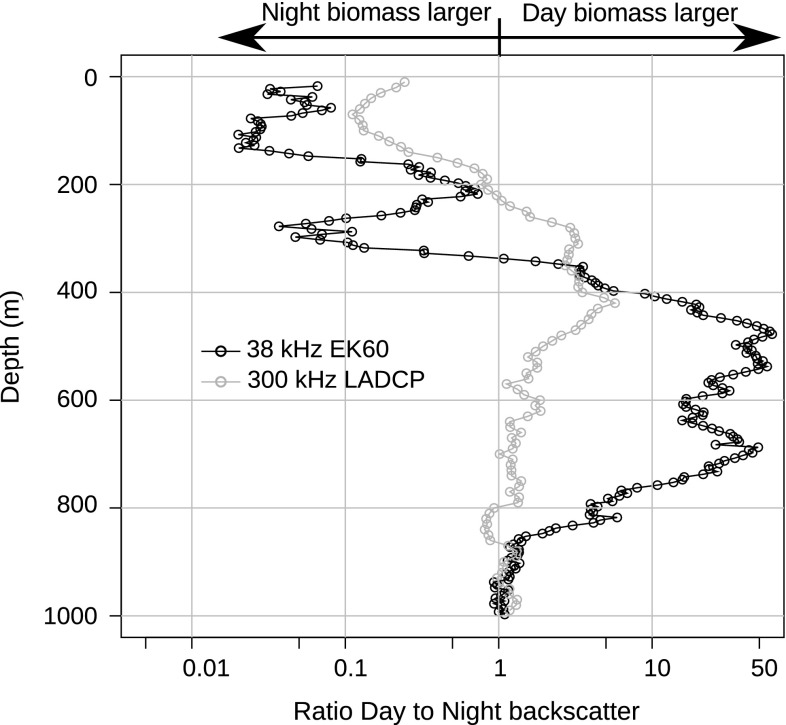
The mesopelagic zone of the Red Sea represents an extreme environment due to low food concentrations, high temperatures and low oxygen waters. Nevertheless, a 38 kHz echosounder identified at least four distinct scattering layers during the daytime, of which the 2 deepest layers resided entirely within the mesopelagic zone. Two of the acoustic layers were found above a mesopelagic oxygen minimum zone (OMZ), one layer overlapped with the OMZ, and one layer was found below the OMZ. Almost all organisms in the deep layers migrated to the near-surface waters during the night. Backscatter from a 300 kHz lowered Acoustic Doppler Current Profiler indicated a layer of zooplankton within the OMZ. They carried out DVM, yet a portion remained at mesopelagic depths during the night. Our acoustic measurements showed that the bulk of the acoustic backscatter was restricted to waters shallower than 800 m, suggesting that most of the biomass in the Red Sea resides above this depth.
Figures
Similar articles
-
Increased prokaryotic diversity in the Red Sea deep scattering layer.Environ Microbiome. 2023 Dec 14;18(1):87. doi: 10.1186/s40793-023-00542-5. Environ Microbiome. 2023. PMID: 38098078 Free PMC article.
-
Large scale patterns in vertical distribution and behaviour of mesopelagic scattering layers.Sci Rep. 2016 Jan 27;6:19873. doi: 10.1038/srep19873. Sci Rep. 2016. PMID: 26813333 Free PMC article.
-
Detecting Mesopelagic Organisms Using Biogeochemical-Argo Floats.Geophys Res Lett. 2020 Mar 28;47(6):e2019GL086088. doi: 10.1029/2019GL086088. Epub 2020 Mar 10. Geophys Res Lett. 2020. PMID: 32713981 Free PMC article.
-
Diel vertical migration behaviour of the Northern krill (Meganyctiphanes norvegica Sars).Adv Mar Biol. 2010;57:255-75. doi: 10.1016/B978-0-12-381308-4.00009-1. Adv Mar Biol. 2010. PMID: 20955895 Review.
-
Vision in the deep sea.Biol Rev Camb Philos Soc. 2004 Aug;79(3):671-712. doi: 10.1017/s1464793103006420. Biol Rev Camb Philos Soc. 2004. PMID: 15366767 Review.
Cited by
-
Exploring the larval fish community of the central Red Sea with an integrated morphological and molecular approach.PLoS One. 2017 Aug 3;12(8):e0182503. doi: 10.1371/journal.pone.0182503. eCollection 2017. PLoS One. 2017. PMID: 28771590 Free PMC article.
-
A shallow scattering layer structures the energy seascape of an open ocean predator.Sci Adv. 2023 Oct 4;9(40):eadi8200. doi: 10.1126/sciadv.adi8200. Epub 2023 Oct 4. Sci Adv. 2023. PMID: 37792940 Free PMC article.
-
In situ observations show vertical community structure of pelagic fauna in the eastern tropical North Atlantic off Cape Verde.Sci Rep. 2020 Dec 11;10(1):21798. doi: 10.1038/s41598-020-78255-9. Sci Rep. 2020. PMID: 33311534 Free PMC article.
-
Increased prokaryotic diversity in the Red Sea deep scattering layer.Environ Microbiome. 2023 Dec 14;18(1):87. doi: 10.1186/s40793-023-00542-5. Environ Microbiome. 2023. PMID: 38098078 Free PMC article.
-
Diving behavior of the reef manta ray links coral reefs with adjacent deep pelagic habitats.PLoS One. 2014 Feb 6;9(2):e88170. doi: 10.1371/journal.pone.0088170. eCollection 2014. PLoS One. 2014. PMID: 24516605 Free PMC article.
References
-
- Angel M, Pugh P. Quantification of diel vertical migration by micronektonic taxa in the northeast Atlantic. Hydrobiologia. 2000;440:161–179. doi: 10.1023/A:1004115010030. - DOI
-
- Ashjian CJ, Smith SL, Flagg CN, Idrisi N. Distribution, annual cycle, and vertical migration of acoustically derived biomass in the Arabian Sea during 1994–1995. Deep-Sea Res Part II. 2002;49:2377–2402. doi: 10.1016/S0967-0645(02)00041-3. - DOI
-
- Badcock J, Merrett NR. Midwater fishes in the eastern North Atlantic–I. Vertical distribution and associated biology in 30°N, 23°W, with developmental notes on certain myctophids. Prog Oceanogr. 1976;7:3–58. doi: 10.1016/0079-6611(76)90003-3. - DOI
LinkOut - more resources
Full Text Sources