Review
. 2012;159(8):1853-1864.
doi: 10.1007/s00227-012-1945-2. Epub 2012 May 22.

An approach for particle sinking velocity measurements in the 3-400 μm size range and considerations on the effect of temperature on sinking rates

Affiliations
Review

An approach for particle sinking velocity measurements in the 3-400 μm size range and considerations on the effect of temperature on sinking rates

Lennart Thomas Bach et al. Mar Biol. 2012.

Abstract

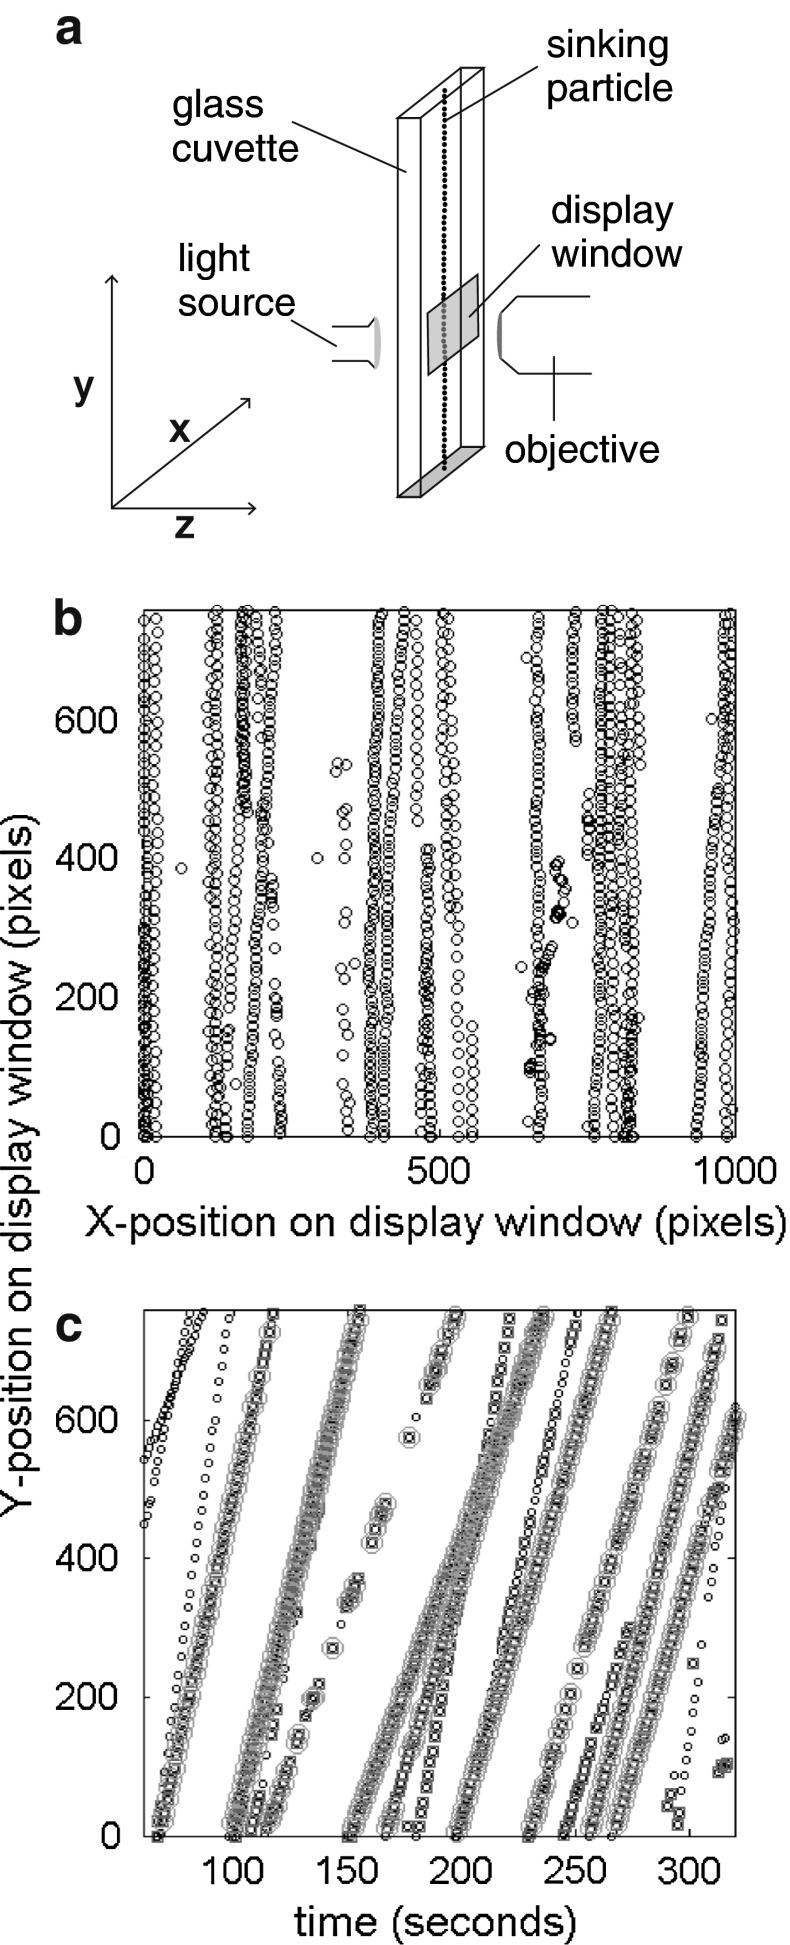
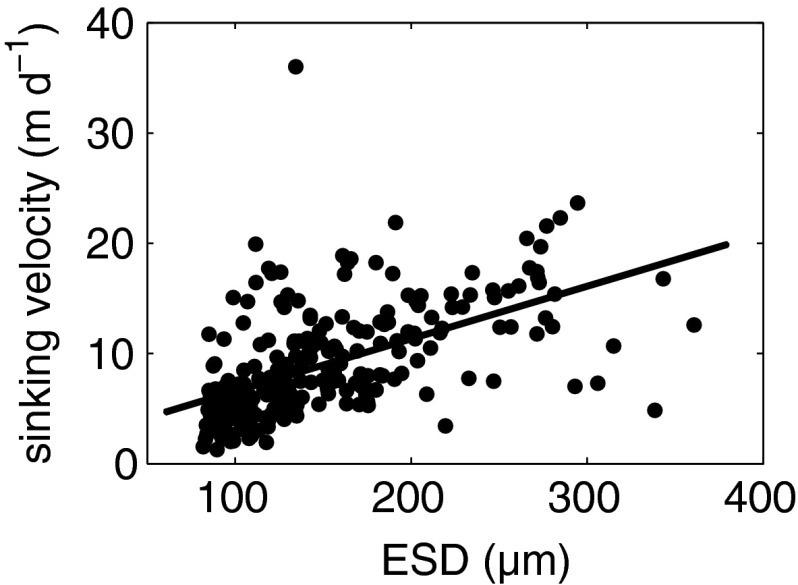
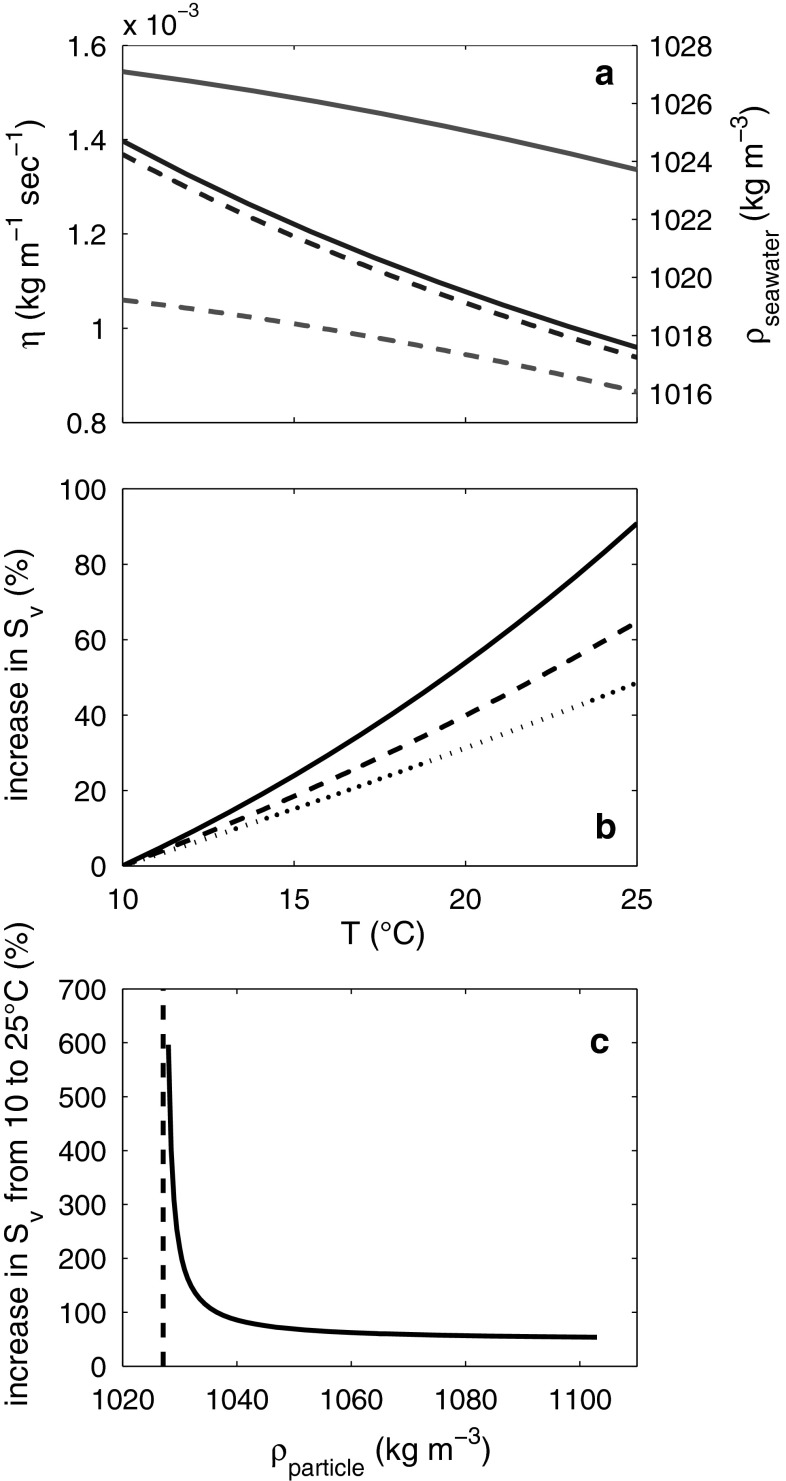
The flux of organic particles below the mixed layer is one major pathway of carbon from the surface into the deep ocean. The magnitude of this export flux depends on two major processes-remineralization rates and sinking velocities. Here, we present an efficient method to measure sinking velocities of particles in the size range from approximately 3-400 μm by means of video microscopy (FlowCAM®). The method allows rapid measurement and automated analysis of mixed samples and was tested with polystyrene beads, different phytoplankton species, and sediment trap material. Sinking velocities of polystyrene beads were close to theoretical values calculated from Stokes' Law. Sinking velocities of the investigated phytoplankton species were in reasonable agreement with published literature values and sinking velocities of material collected in sediment trap increased with particle size. Temperature had a strong effect on sinking velocities due to its influence on seawater viscosity and density. An increase in 9 °C led to a measured increase in sinking velocities of ~40 %. According to this temperature effect, an average temperature increase in 2 °C as projected for the sea surface by the end of this century could increase sinking velocities by about 6 % which might have feedbacks on carbon export into the deep ocean.


Figures

Fig. 1
Fig. 1
Evaluation of measured sinking velocities. a Sketch of the optical setup during a measurement. The dotted line denotes a particle that is sinking through the glass cuvette and photographed when passing the display window. b X- and Y-position of all particles photographed by the camera during the measurement. The dotted lines denote individual particles (in this case Rhodomonas spec.) falling vertically through the display window. Note irregularities in particle shape can cause small sidewards movements because particles start to glide to some extent. c Y-position of all measured particles on the display window plotted against the exact time the particles were photographed. The slopes of the dotted lines represent individual sinking velocities. The faster a particle is sinking, the steeper the slope. Red squares on dots mark those ones which were detected by the MATLAB analysis script as similar particle within a line. Green circles around marked lines are those particles which were finally evaluated since only the fits through these lines had R² ≥ 0.995
Fig. 2
Fig. 2
Sinking velocities of polystyrene beads. a Comparison of repeated sinking velocity measurements of polystyrene beads of known diameter (10 ± 0.09 μm) and density (1,053 kg m−3 ±0.3, Giddings and Ho (1995)) with the theoretical value calculated according to Stokes’ Law (Eq. 1). Gray bars denote the mean of on average 23 beads (±standard deviation). The horizontal solid black line depicts the theoretical sinking velocity calculated from Stokes’ Law, while the dashed black lines illustrate its upper and lower limits. These limits were calculated from an error propagation with uncertainties in size and ρ particle given above, and an uncertainty of 2.6 10−5 kg m−1 s−1 in η seawater and 0.3 10−3 kg m−3 in ρ seawater. The uncertainties in η seawater and ρ seawater are caused by an estimated uncertainty of 1 °C in the temperature-controlled room. b Measured sinking velocities in relation to size. Red triangles and blue dots are beads sinking in seawater of 19 and 10 °C, respectively. The two lines denote theoretical sinking velocities according to Stokes’ Law (dashed line for 19 °C, straight line for 10 °C). c Same data as in (b) but corrected for wall effects (Eq. 3)
Fig. 3
Fig. 3
Sinking velocities of sediment trap material in relation to ESD. R 2 = 0.31, p < 0.0001
Fig. 4
Fig. 4
Influence of temperature on η seawater, ρ seawater, and S v. a Change of η seawater and ρ seawater in relation to temperature at two different salinities (dashed lines, S = 25; straight lines, S = 35). Red lines denote for ρ seawater changes and blue lines for η seawater changes. b Relative increase in S v according to Stokes’ Law of particles with different density (straight line = ρ particle of 1,038 kg m−3, dashed line = ρ particle of 1,053 kg m−3, dotted line = ρ particle of 1,200 kg m−3). Salinity in these calculations was 35. c Relative increase in particle sinking velocity from 10 to 25 °C with increasing ρ particle. The dashed line denotes seawater density of 1,027 kg m−3. Calculations in (b) and (c) were performed using Stokes’ Law

References

    1. Armstrong RA, Lee C, Hedges JI, Honjo S, Wakeham SG. A new, mechanistic model for organic carbon fluxes in the ocean based on the quantitative association of POC with ballast minerals. Deep-Sea Res Pt I. 2002;49:219–236.
    1. Bienfang PK. SETCOL: a technologically simple and reliable method for measuring phytoplankton sinking rates. Can J Fish Aquat Sci. 1981;38:1289–1294. doi: 10.1139/f81-173. - DOI
    1. Bienfang PK, Harrison PJ, Quarmby LM. Sinking rate response to depletion of nitrate, phosphate and silicate in four marine diatoms. Mar Biol. 1982;67:295–302. doi: 10.1007/BF00397670. - DOI
    1. Brenner H. Effect of finite boundaries on the Stokes’ resistance of an arbitrary particle. J Fluid Mech. 1962;12:35–48. doi: 10.1017/S0022112062000026. - DOI
    1. Bruland KW, Silver MW. Sinking rates of fecal pellets from gelatinous zooplankton (salps, pteropods, doliolids) Mar Biol. 1981;63:295–300. doi: 10.1007/BF00395999. - DOI

LinkOut - more resources