. 2013 Dec;11(12):e1001752.
doi: 10.1371/journal.pbio.1001752. Epub 2013 Dec 31.

Speech rhythms and multiplexed oscillatory sensory coding in the human brain

Affiliations

Speech rhythms and multiplexed oscillatory sensory coding in the human brain

Joachim Gross et al. PLoS Biol. 2013 Dec.

Abstract

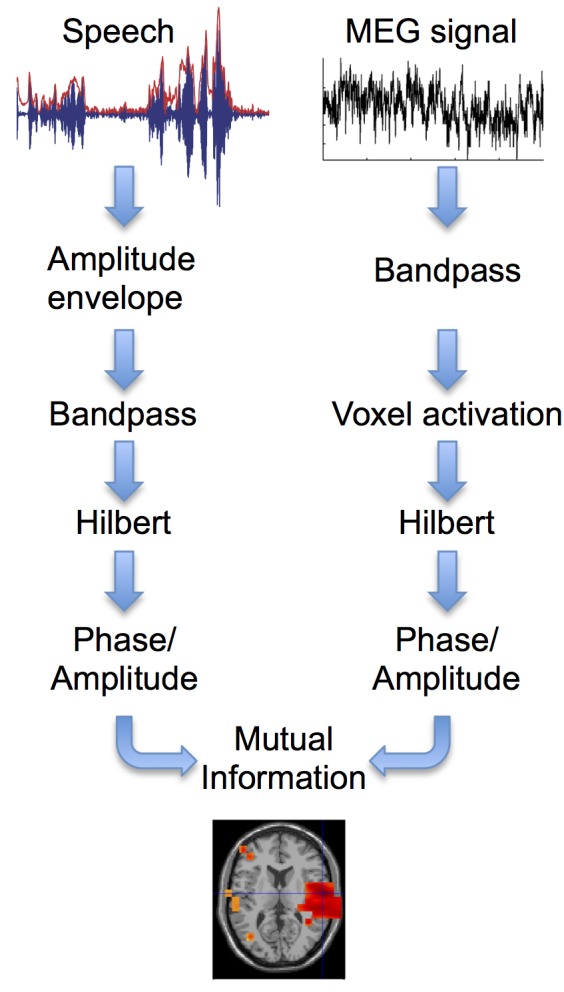
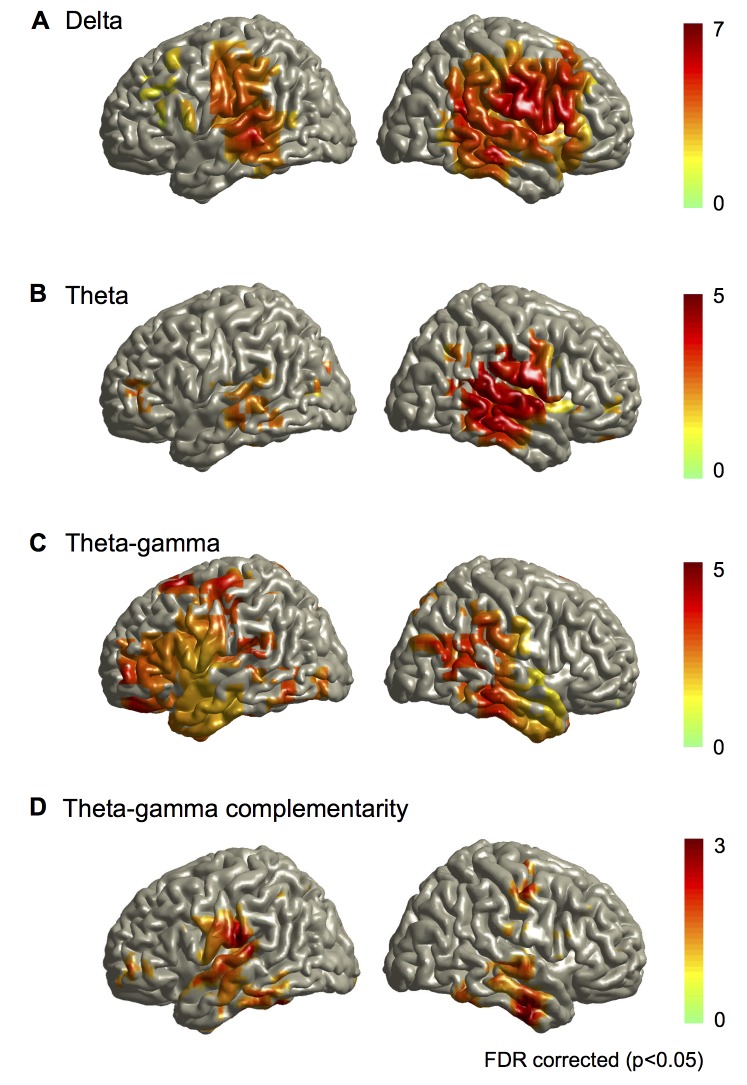
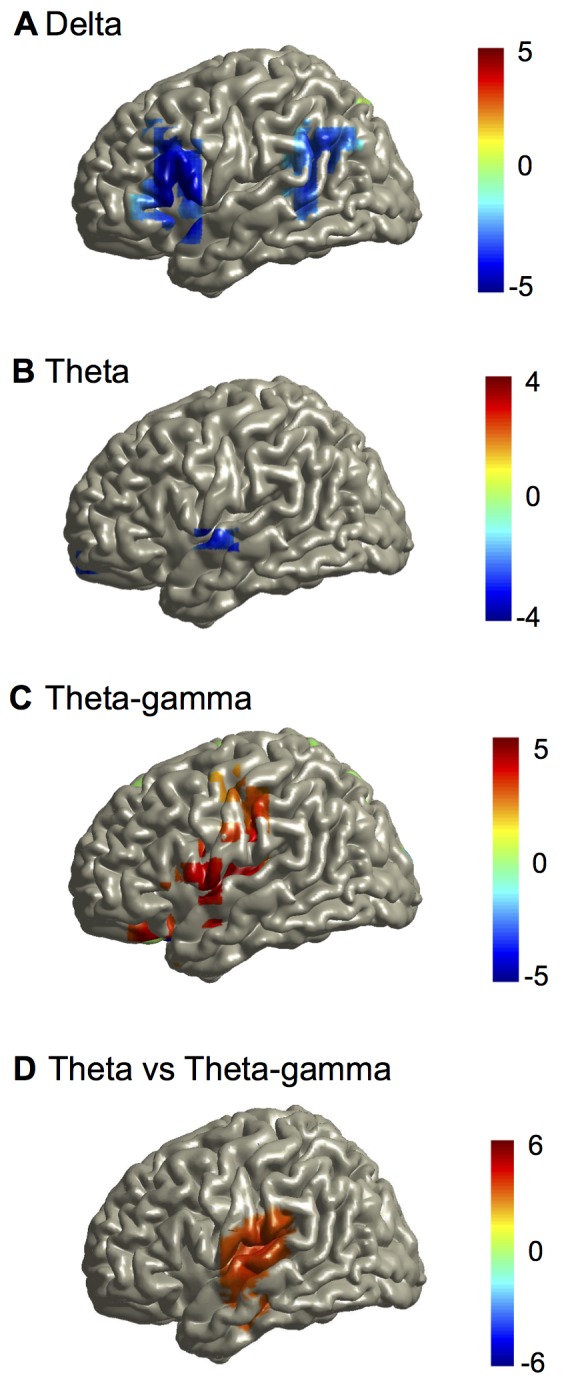
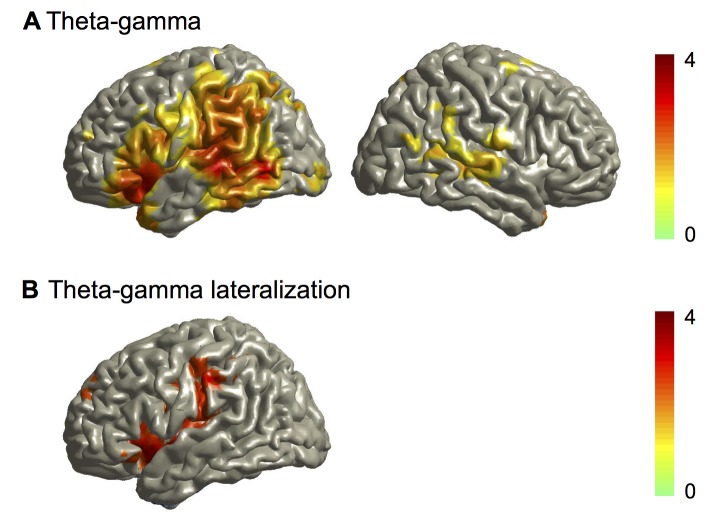
Cortical oscillations are likely candidates for segmentation and coding of continuous speech. Here, we monitored continuous speech processing with magnetoencephalography (MEG) to unravel the principles of speech segmentation and coding. We demonstrate that speech entrains the phase of low-frequency (delta, theta) and the amplitude of high-frequency (gamma) oscillations in the auditory cortex. Phase entrainment is stronger in the right and amplitude entrainment is stronger in the left auditory cortex. Furthermore, edges in the speech envelope phase reset auditory cortex oscillations thereby enhancing their entrainment to speech. This mechanism adapts to the changing physical features of the speech envelope and enables efficient, stimulus-specific speech sampling. Finally, we show that within the auditory cortex, coupling between delta, theta, and gamma oscillations increases following speech edges. Importantly, all couplings (i.e., brain-speech and also within the cortex) attenuate for backward-presented speech, suggesting top-down control. We conclude that segmentation and coding of speech relies on a nested hierarchy of entrained cortical oscillations.


Conflict of interest statement

The authors have declared that no competing interests exist.

Figures

Figure 1
Figure 1. Mutual information analysis.
The broadband amplitude envelope is computed for the speech signal. For each frequency band speech envelope and MEG signals are bandpass filtered and activation time series are computed for each voxel in the brain. Phase and amplitude time series are computed from the Hilbert transform for speech and voxel time series and subjected to MI analysis. MI is computed between speech signal and time series for each voxel leading to a tomographic map of MI. Group statistical analysis is performed on these maps across all 22 participants.
Figure 2
Figure 2. Mutual information group statistics.
All statistical maps are thresholded at p = 0.05 (FDR corrected) and colourbars show t-values. (A) Group statistical map of MI between speech phase and phase of brain activity in the delta frequency band (1–3 Hz) for the statistical contrast story versus back (see Figure S1 for corresponding map using PLV). (B) Group statistical map of MI between speech phase and phase of brain activity in the theta frequency band (3–7 Hz) for the statistical contrast story versus back (see Figure S1 for corresponding map using surrogate data). (C) Group statistical map of MI between 3–7 Hz theta phase in speech signal and 35–45 Hz gamma amplitude in brain activity for the contrast story versus back. (D) Complementarity between theta phase and gamma amplitude. Mutual information between theta phase in speech and theta phase in brain activity was computed with and without corresponding gamma amplitude signal. The statistical map shows significantly increased MI when gamma amplitude is used in addition to theta phase.
Figure 3
Figure 3. Mutual information group statistics of lateralisation in the story condition.
All maps show t-statistics of lateralisation index (left−right)/(left+right) of mutual information. Red colours indicate lateralisation to the left cortical areas. Only the left hemisphere is shown because results are redundant in the right hemisphere. (A) Group statistical map of lateralisation of delta band MI (corresponding to Figure 2A). (B) Group statistical map of lateralisation of theta band MI (corresponding to Figure 2B). (C) Group statistical map of lateralisation of theta phase to gamma amplitude coupling (corresponding to Figure 2C). (D) Group statistical map comparing theta phase to gamma-amplitude lateralisation versus theta phase lateralisation. Maps are thresholded at p = 0.05 (FDR corrected).
Figure 4
Figure 4. Group statistics of cross-frequency coupling.
(A) Statistical map of difference between story and back condition for mutual information between theta phase and gamma amplitude. (B) Statistical map of lateralisation of mutual information between theta phase and gamma amplitude for the story condition.
Figure 5
Figure 5. Phase-locking value in the auditory cortex time-locked to temporal speech edges.
Phase-locking in theta frequency band between low-frequency speech envelope and the left (PLV speech L, blue solid line) and right (PLV speech R, red solid line) auditory cortex is shown following edge onset at 0 ms. Dashed lines show phase-locking across trials (regardless of speech signal) timelocked to edge onset for left (PLV L, blue dashed line) and right (PLV R, red dashed line). The black line represents phase-locking between the left and right auditory cortex.
Figure 6
Figure 6. Oscillatory speech sampling.
(A) Speech envelope (black line) and cosine of theta phase of the right auditory cortex of one participant for one trial. (B) The spatial distribution of significant correlation between low-frequency (3–7 Hz) phase and speech envelope (p<0.05, FDR corrected). The statistical map shows t-values of the statistical contrast between correlations for the story condition and trial-shuffled surrogate data. (C) Spectrum of cross-correlation between oscillations in the left and right auditory cortex and speech envelope. Black lines correspond to correlations based on the cosine of phase and blue lines to correlations based on amplitude. Solid lines represent the right auditory cortex and dashed lines represent the left auditory cortex. Horizontal dotted lines show 95th percentile of chance distribution of the maximum across frequencies obtained from shuffled data for phase (black) and amplitude (blue).
Figure 7
Figure 7. Cross-frequency phase-amplitude coupling.
(A) Spatial distribution of theta phase to gamma amplitude coupling. Group statistical map of difference between story and back condition thresholded at p = 0.05 (FDR corrected). Colour code represents t-values. (B) Spectral distribution of phase-amplitude coupling in the auditory cortex. Cross-frequency phase-amplitude coupling quantified with MI is shown for the left and right auditory cortex. Pixels with significant difference between story and surrogate condition are displayed as opaque. (C) Lateralisation of cross-frequency phase-amplitude coupling. Pixels with significant lateralisation are displayed as opaque. Positive t-values indicate left-lateralized effects.

Comment in

References

    1. Wang Y, Ding N, Ahmar N, Xiang J, Poeppel D, Simon JZ (2012) Sensitivity to temporal modulation rate and spectral bandwidth in the human auditory system: MEG evidence. J Neurophysiol 107: 2033–2041. - PMC - PubMed
    1. Siegel M, Donner TH, Engel AK (2012) Spectral fingerprints of large-scale neuronal interactions. Nat Rev Neurosci 13: 121–134. - PubMed
    1. Schnitzler A, Gross J (2005) Normal and pathological oscillatory communication in the brain. Nat Rev Neurosci 6: 285–296. - PubMed
    1. Lakatos P, Shah AS, Knuth KH, Ulbert I, Karmos G, Schroeder CE (2005) An oscillatory hierarchy controlling neuronal excitability and stimulus processing in the auditory cortex. J Neurophysiol 94: 1904–1911. - PubMed
    1. Canolty RT, Edwards E, Dalal SS, Soltani M, Nagarajan SS, et al. (2006) High gamma power is phase-locked to theta oscillations in human neocortex. Science 313: 1626–1628. - PMC - PubMed

Publication types

LinkOut - more resources