

Circulating mitochondrial DNA in patients in the ICU as a marker of mortality: derivation and validation
- PMID: 24391478
- PMCID: PMC3876981
- DOI: 10.1371/journal.pmed.1001577
Circulating mitochondrial DNA in patients in the ICU as a marker of mortality: derivation and validation
Abstract
Background: Mitochondrial DNA (mtDNA) is a critical activator of inflammation and the innate immune system. However, mtDNA level has not been tested for its role as a biomarker in the intensive care unit (ICU). We hypothesized that circulating cell-free mtDNA levels would be associated with mortality and improve risk prediction in ICU patients.
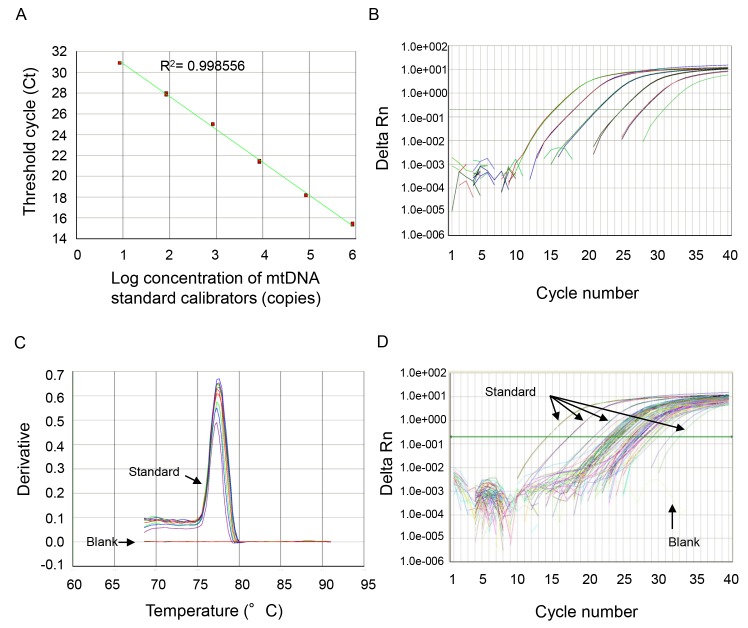
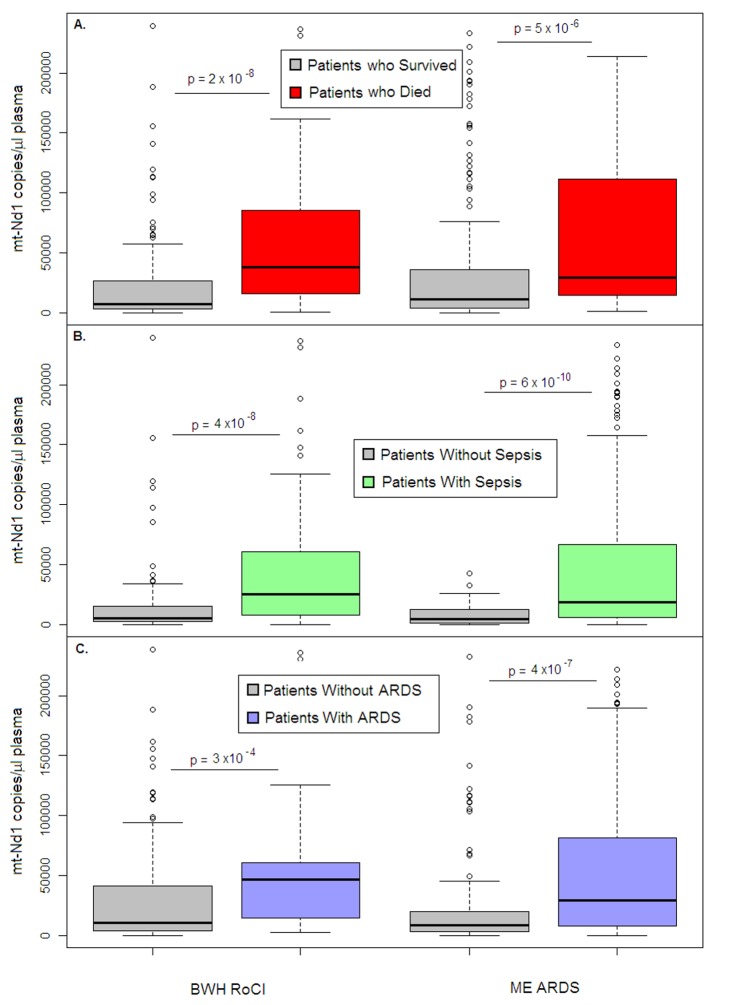
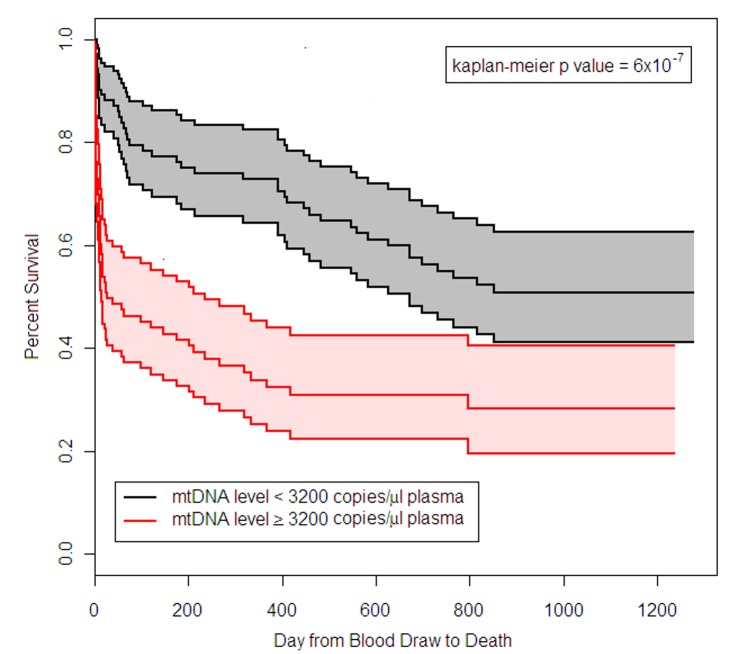
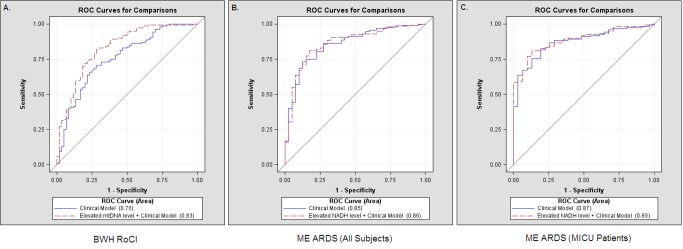
Methods and findings: Analyses of mtDNA levels were performed on blood samples obtained from two prospective observational cohort studies of ICU patients (the Brigham and Women's Hospital Registry of Critical Illness [BWH RoCI, n = 200] and Molecular Epidemiology of Acute Respiratory Distress Syndrome [ME ARDS, n = 243]). mtDNA levels in plasma were assessed by measuring the copy number of the NADH dehydrogenase 1 gene using quantitative real-time PCR. Medical ICU patients with an elevated mtDNA level (≥3,200 copies/µl plasma) had increased odds of dying within 28 d of ICU admission in both the BWH RoCI (odds ratio [OR] 7.5, 95% CI 3.6-15.8, p = 1×10(-7)) and ME ARDS (OR 8.4, 95% CI 2.9-24.2, p = 9×10(-5)) cohorts, while no evidence for association was noted in non-medical ICU patients. The addition of an elevated mtDNA level improved the net reclassification index (NRI) of 28-d mortality among medical ICU patients when added to clinical models in both the BWH RoCI (NRI 79%, standard error 14%, p<1×10(-4)) and ME ARDS (NRI 55%, standard error 20%, p = 0.007) cohorts. In the BWH RoCI cohort, those with an elevated mtDNA level had an increased risk of death, even in analyses limited to patients with sepsis or acute respiratory distress syndrome. Study limitations include the lack of data elucidating the concise pathological roles of mtDNA in the patients, and the limited numbers of measurements for some of biomarkers.
Conclusions: Increased mtDNA levels are associated with ICU mortality, and inclusion of mtDNA level improves risk prediction in medical ICU patients. Our data suggest that mtDNA could serve as a viable plasma biomarker in medical ICU patients.
Conflict of interest statement
All of the authors except SW declare no conflict of interests. SW has declared: “I've received funding for investigator-initiated studies from Merck, Genzyme, Otsuka, and Satellite Healthcare. I've provided consulting services to BioTrends Research Group, Harvard Clinical Research Institute, and GE Healthcare. I serve on a DSMB for Takeda.”
Figures
References
-
- Schetz MR, Van den Berghe G (2005) Do we have reliable biochemical markers to predict the outcome of critical illness? Int J Artif Organs 28: 1197–1210. - PubMed
-
- Aduen J, Bernstein WK, Khastgir T, Miller J, Kerzner R, et al. (1994) The use and clinical importance of a substrate-specific electrode for rapid determination of blood lactate concentrations. JAMA 272: 1678–1685. - PubMed
-
- Christ-Crain M, Jaccard-Stolz D, Bingisser R, Gencay MM, Huber PR, et al. (2004) Effect of procalcitonin-guided treatment on antibiotic use and outcome in lower respiratory tract infections: cluster-randomised, single-blinded intervention trial. Lancet 363: 600–607. - PubMed
Publication types
MeSH terms
Substances
Grants and funding
- P01 HL108801/HL/NHLBI NIH HHS/United States
- R01 HL087115/HL/NHLBI NIH HHS/United States
- R01 HL060710/HL/NHLBI NIH HHS/United States
- R01 HL111024/HL/NHLBI NIH HHS/United States
- R01 HL060234/HL/NHLBI NIH HHS/United States
- T32 HL007118/HL/NHLBI NIH HHS/United States
- K08 HL092222/HL/NHLBI NIH HHS/United States
- R01 HL079904/HL/NHLBI NIH HHS/United States
- T32 HL007680/HL/NHLBI NIH HHS/United States
- R01 HL091957/HL/NHLBI NIH HHS/United States
- T32 HL007633/HL/NHLBI NIH HHS/United States
- K08 GM083207/GM/NIGMS NIH HHS/United States
- ES00002/ES/NIEHS NIH HHS/United States
- P30 ES000002/ES/NIEHS NIH HHS/United States
- R01 HL086919/HL/NHLBI NIH HHS/United States
- R01 HL112747/HL/NHLBI NIH HHS/United States
- T32 HL7118/HL/NHLBI NIH HHS/United States
- R01 HL055330/HL/NHLBI NIH HHS/United States
LinkOut - more resources
Full Text Sources
Other Literature Sources
Medical
