

Population decoding in rat barrel cortex: optimizing the linear readout of correlated population responses
- PMID: 24391487
- PMCID: PMC3879135
- DOI: 10.1371/journal.pcbi.1003415
Population decoding in rat barrel cortex: optimizing the linear readout of correlated population responses
Abstract
Sensory information is encoded in the response of neuronal populations. How might this information be decoded by downstream neurons? Here we analyzed the responses of simultaneously recorded barrel cortex neurons to sinusoidal vibrations of varying amplitudes preceded by three adapting stimuli of 0, 6 and 12 µm in amplitude. Using the framework of signal detection theory, we quantified the performance of a linear decoder which sums the responses of neurons after applying an optimum set of weights. Optimum weights were found by the analytical solution that maximized the average signal-to-noise ratio based on Fisher linear discriminant analysis. This provided a biologically plausible decoder that took into account the neuronal variability, covariability, and signal correlations. The optimal decoder achieved consistent improvement in discrimination performance over simple pooling. Decorrelating neuronal responses by trial shuffling revealed that, unlike pooling, the performance of the optimal decoder was minimally affected by noise correlation. In the non-adapted state, noise correlation enhanced the performance of the optimal decoder for some populations. Under adaptation, however, noise correlation always degraded the performance of the optimal decoder. Nonetheless, sensory adaptation improved the performance of the optimal decoder mainly by increasing signal correlation more than noise correlation. Adaptation induced little systematic change in the relative direction of signal and noise. Thus, a decoder which was optimized under the non-adapted state generalized well across states of adaptation.
Conflict of interest statement
The authors have declared that no competing interests exist.
Figures
 ,
,  and
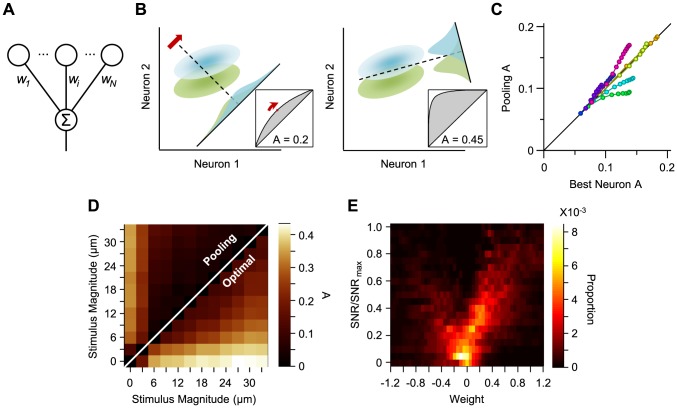
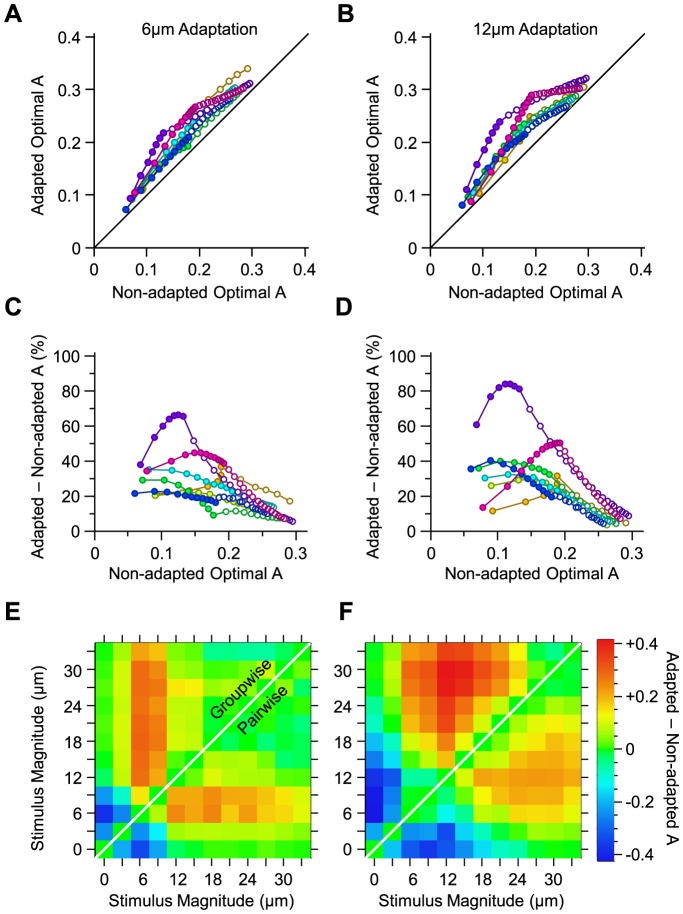
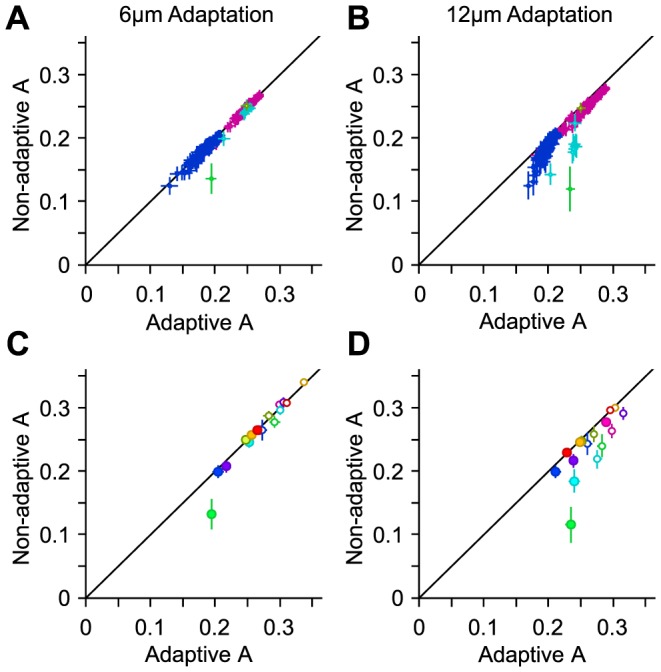
and  represent the synaptic weights between the neurons (top row circles) and the decoder (bottom). B. Schematic representation of pooling (left panel) and optimal decoding (right panel). The green and blue ovals represent the joint distribution of the neurons' responses to two sensory stimuli. The solid black line represents the weight vector. The pooling method (left panel) is equivalent to a weight vector along the identity line. The bell-shaped areas on the weight vector represent the projection of the neuronal response distribution for each stimulus. Dashed lines correspond to the best criterion to discriminate the two stimuli. The insets show the hit rate versus false alarm rate (ROC) for every possible criterion, shading indicates area A. C. Average value of A for the pooled neuronal responses plotted against the average value of A for the best neuron. Various population sizes within a session are plotted with the same color and connected with a line. For each population size, the value of A is averaged across all possible selections of that size. D. The average value of A, for each stimulus pair, under pooling (upper triangle) and optimal decoding (lower triangle), across all populations of 8 single neurons. E. Histogram of the optimal weights as a function of the signal-to-noise ratio of the same neuronal populations as in D. The weights and SNR values are normalized to the best neuron in each population.
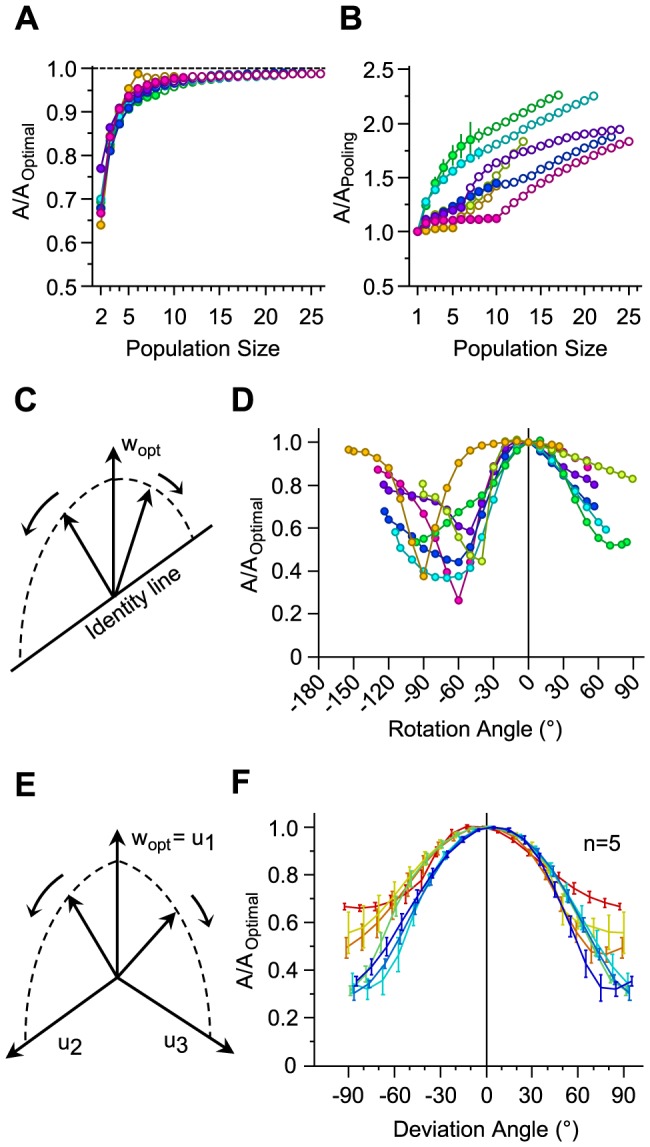
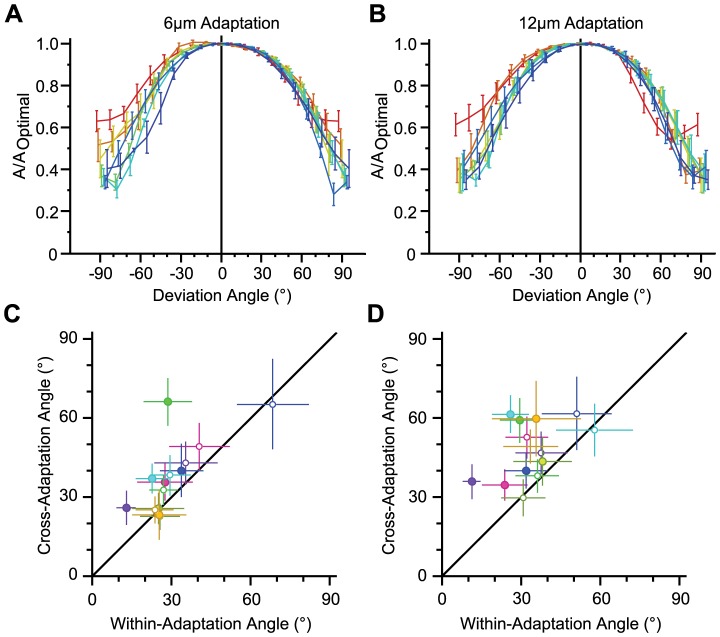
 , towards every other dimension in the space of neuronal activities. Dimensions are orthogonal, and span the space of the neuronal activity. The trajectory of this rotation lies on the 2-dimensional plane spanned by the optimal direction and the target dimension, and hence is perpendicular to all other dimensions. F. The relative performance of decoder with a deviated weight vector compared to the optimal direction for all possible populations of 8 neurons averaged across sessions (n = 5). Colors indicate the 7 trajectories toward associated dimensions, with red corresponding to the dimension perpendicular to optimal direction such that it maximizes the separation between neuronal responses, and blue corresponding to the dimension along which the separation between neuronal responses is minimal. Error bars indicate standard error of the means.
References
Publication types
MeSH terms
LinkOut - more resources
Full Text Sources
Other Literature Sources
