. 2014 Jan;10(1):e1004047.
doi: 10.1371/journal.pgen.1004047. Epub 2014 Jan 2.

In-vivo quantitative proteomics reveals a key contribution of post-transcriptional mechanisms to the circadian regulation of liver metabolism

Affiliations

In-vivo quantitative proteomics reveals a key contribution of post-transcriptional mechanisms to the circadian regulation of liver metabolism

Maria S Robles et al. PLoS Genet. 2014 Jan.

Abstract

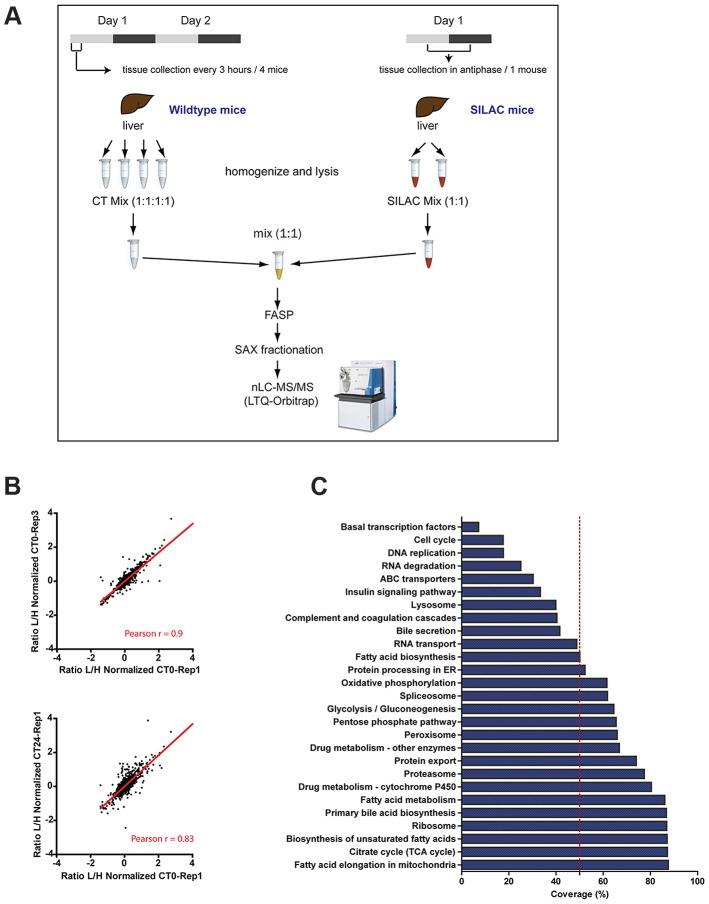
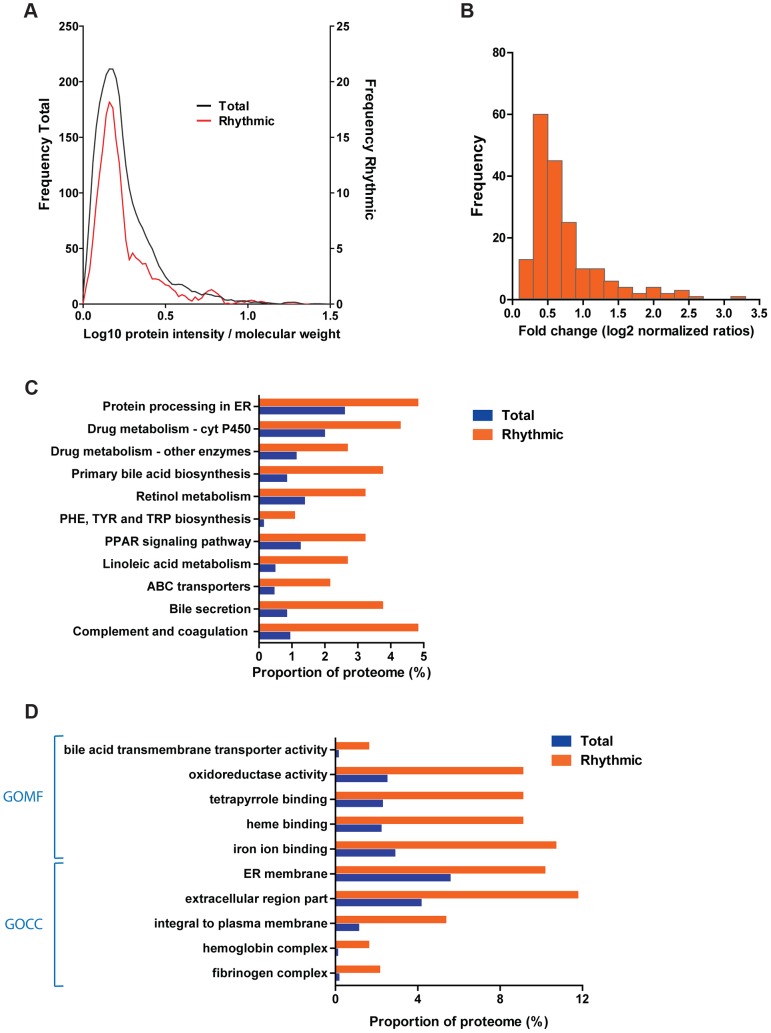
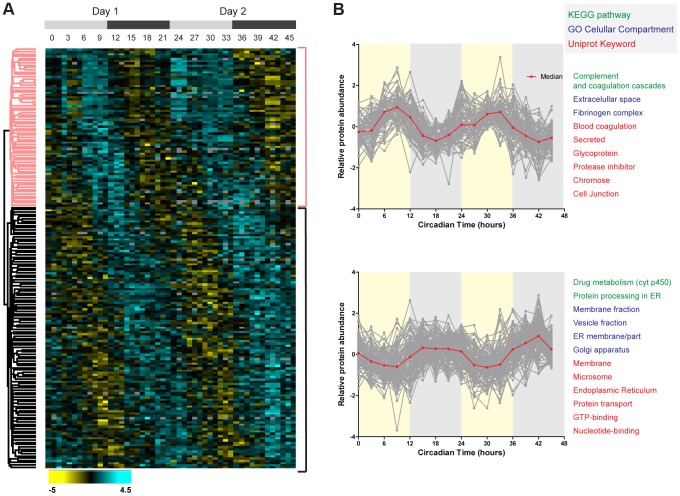
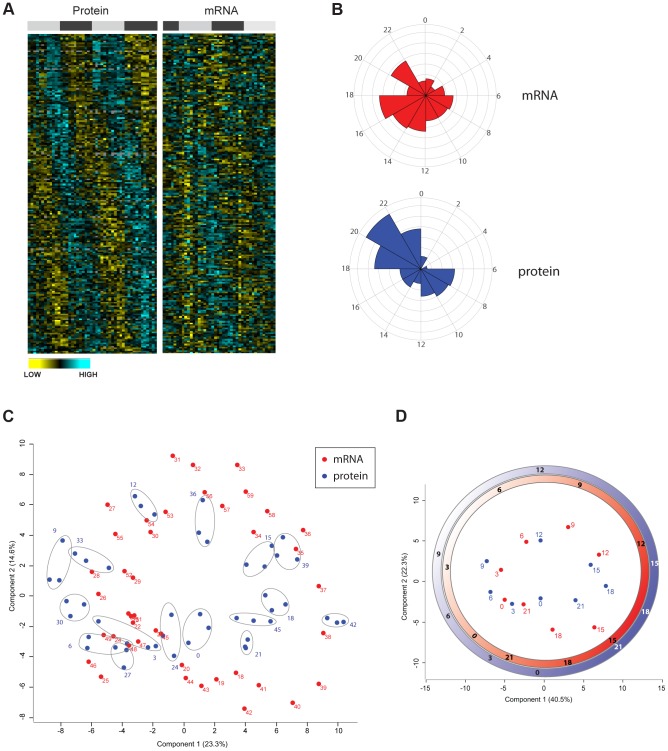
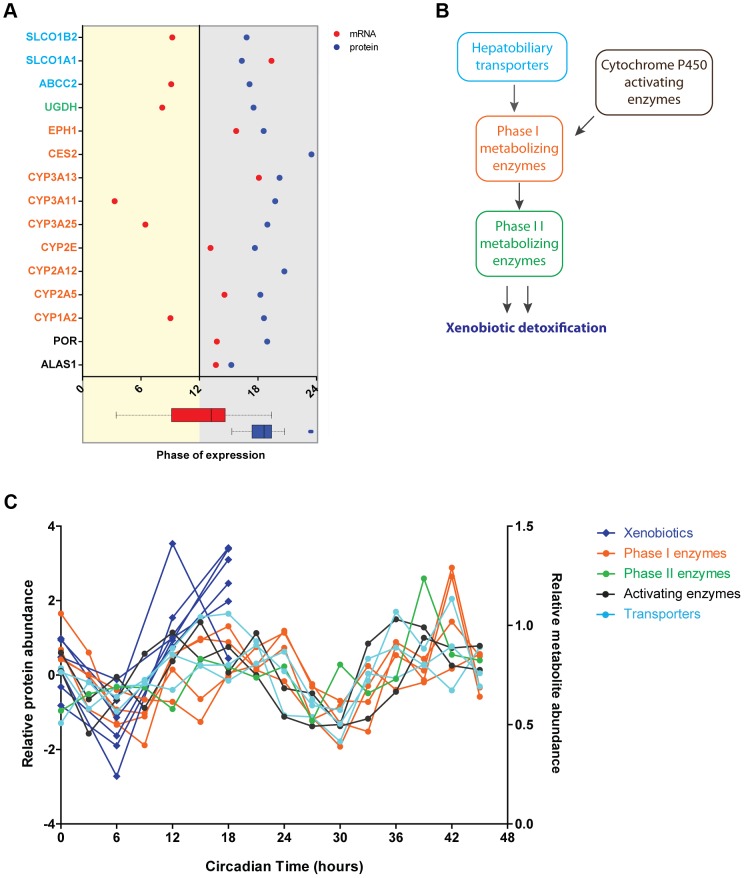
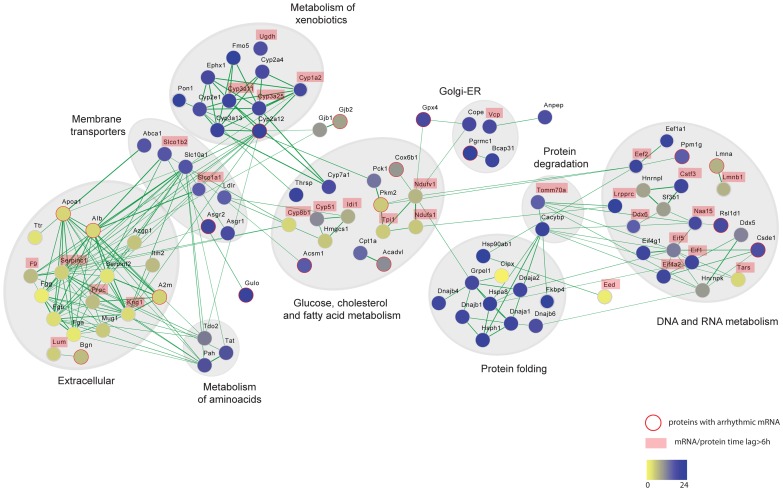
Circadian clocks are endogenous oscillators that drive the rhythmic expression of a broad array of genes, orchestrating metabolism and physiology. Recent evidence indicates that post-transcriptional and post-translational mechanisms play essential roles in modulating temporal gene expression for proper circadian function, particularly for the molecular mechanism of the clock. Due to technical limitations in large-scale, quantitative protein measurements, it remains unresolved to what extent the circadian clock regulates metabolism by driving rhythms of protein abundance. Therefore, we aimed to identify global circadian oscillations of the proteome in the mouse liver by applying in vivo SILAC mouse technology in combination with state of the art mass spectrometry. Among the 3000 proteins accurately quantified across two consecutive cycles, 6% showed circadian oscillations with a defined phase of expression. Interestingly, daily rhythms of one fifth of the liver proteins were not accompanied by changes at the transcript level. The oscillations of almost half of the cycling proteome were delayed by more than six hours with respect to the corresponding, rhythmic mRNA. Strikingly we observed that the length of the time lag between mRNA and protein cycles varies across the day. Our analysis revealed a high temporal coordination in the abundance of proteins involved in the same metabolic process, such as xenobiotic detoxification. Apart from liver specific metabolic pathways, we identified many other essential cellular processes in which protein levels are under circadian control, for instance vesicle trafficking and protein folding. Our large-scale proteomic analysis reveals thus that circadian post-transcriptional and post-translational mechanisms play a key role in the temporal orchestration of liver metabolism and physiology.


Conflict of interest statement

The authors have declared that no competing interests exist.

Figures

Figure 1
Figure 1. SILAC-based circadian proteome of the mouse liver.
(A) Schematic representation of the workflow followed to perform the quantitative proteomics analysis of mouse livers harvested sixteen times across two circadian cycles. (B) Sample replicates show high degree of correlation. Scatter plots showing logarithmic normalized protein ratios (Light/High SILAC) in replicate measurements, technical (upper) and biological (lower). Red line shows linear regression of the data and the calculated correlation coefficient (Pearson r) for each pair of replicates is indicated at the bottom. (C) The quantified proteome contains proteins from a broad range of metabolic and cellular processes. Graph shows the percentage of protein coverage for different KEGG pathways observed in the quantified dataset proteome used for the circadian analysis.
Figure 2
Figure 2. The liver circadian proteome.
(A) Liver cycling proteins are not biased towards high abundant proteins. Graph shows the protein abundance distribution of the quantified (black line) and rhythmic (red line) proteome of the liver calculated based on the protein intensity and molecular weight. (B) The majority of cycling proteins change in abundance less than two fold across the cycle. Histogram of protein fold change for the cycling liver proteome calculated based on the expression ratios obtained for each time point measured. (C) Several liver specific metabolic pathways are enriched among the liver cycling proteome. Histogram shows the proportion of proteins from the total quantified (blue) and rhythmic (orange) proteome annotated in the indicated selected KEGG pathways. All the specified categories are statistically enriched in the cycling proteome (Fisher exact test p<0.05) (D) Overrepresentation of proteins associated to cellular insoluble and extracellular fractions in the circadian liver proteome. The graph shows the proportion of proteins annotated to the indicated selected Gene Ontology categories (left), statistically enriched (Benjamini Hochberg FDR<0.05) in the rhythmic (orange) compared to the total quantified (blue) proteome.
Figure 3
Figure 3. Temporal profile of the mouse liver proteome across two consecutive cycles.
(A) Hierarchical clustering of daily rhythmic proteins in mouse liver according to the phase of maximal expression. Values for each protein (rows) at all the circadian times analyzed (columns) are colored based on the abundance ratios, high (light blue) and low (yellow) values (Z-scored normalized ratios) are indicated in the color scale bar at the bottom. Top gray bars indicate the circadian day (light gray) and night (dark gray) of the two consecutive sampled cycles. (B) Plots display the abundance profile of proteins (grey lines) from the day (upper) and night (lower) branches of the dendrogram across the two circadian cycles. Red line represented the calculated median profile in each cluster. Protein categories enriched (FDR<0.05) in each protein cluster are indicated on the right side using a color to indicate the annotation database they belong to.
Figure 4
Figure 4. Divergence in the temporal profile of mouse liver proteome and transcriptome.
(A) Heat maps of circadian rhythmic proteins ordered by the phase of maximal expression as in Figure 3A (left panel) and values for their corresponding transcripts (right panel) obtained from the data published by Hughes et al. . (B) Frequency distribution of abundance phases for mouse liver rhythmic mRNAs (top panel) and their corresponding cycling proteins (bottom panel) across the circadian day. (C) Principal component analysis of the circadian proteome (blue) as well the transcriptome (red) based on their abundance values. Data of technical triplicate measurements of the proteome for each time point are grouped with grey ellipses. (D) Graphical representation of the time coordinates of a 24 hour cycle (as in an analog clock) calculated based on the proteome (red) and transcriptome (blue) data. Time delay between transcriptome and proteome can be observed with strikingly different intervals across the circadian cycle.
Figure 5
Figure 5. Circadian regulation of metabolism of xenobiotics is large shaped post-transcriptionally.
(A) Cycling proteins involved in metabolism of xenobiotics show concomitant phases of abundance in the middle of the night. Graph showed calculated phases of abundance for cycling proteins (blue) involved in the detoxification pathway and their corresponding mRNA (red). Lack of mRNA data in the graph indicates an arrhythmic transcript. At the bottom box plots representing graphically the data of the mRNA (red) and protein (blue) phases plotted in the graph. Protein names are color coded based on their functional role in the pathway as indicated in B. We found 97 proteins involved in this pathway in the total 3131 dataset and 15 proteins in the cycling dataset of 201. (B) Circadian oscillations are found in proteins essential for different stages of the metabolism of xenobiotics. Scheme showing the main two phases of xenobiotic detoxification as well as the contribution of enzymes activating cytochrome P450 proteins essential for phase I and liver transporters. (C) The abundance of rhythmic proteins from the detoxification pathway matches remarkably the levels of xenobiotics in the liver. Expression profiles of cycling proteins (median of Z-scored log 2 normalized ratios for each triplicate) color coded according to their functional role (as in B) and the abundance profile of several xenobiotics n the liver reported by Eckel-Mahan et al. .
Figure 6
Figure 6. Protein interaction networks of rhythmic liver proteins.
Broad range of functional categories can be depicted in the protein interaction network of the circadian liver proteome. The analysis was done using protein interaction information from the STRING database and visualized using Cytoscape. Each node represents a protein that is colored based on the phase of the abundance cycle as indicated in the lower color bar. Red lined nodes designate oscillating proteins which arrhythmic transcripts. Labeled protein names indicate those with time lags between peak of mRNA and protein longer than 6/or protein.

References

    1. Eckel-Mahan K, Sassone-Corsi P (2009) Metabolism control by the circadian clock and vice versa. Nat Struct Mol Biol 16: 462–467. - PMC - PubMed
    1. Takahashi JS, Hong HK, Ko CH, McDearmon EL (2008) The genetics of mammalian circadian order and disorder: implications for physiology and disease. Nat Rev Genet 9: 764–775. - PMC - PubMed
    1. Hughes ME, DiTacchio L, Hayes KR, Vollmers C, Pulivarthy S, et al. (2009) Harmonics of circadian gene transcription in mammals. PLoS Genet 5: e1000442. - PMC - PubMed
    1. Miller BH, McDearmon EL, Panda S, Hayes KR, Zhang J, et al. (2007) Circadian and CLOCK-controlled regulation of the mouse transcriptome and cell proliferation. Proc Natl Acad Sci U S A 104: 3342–3347. - PMC - PubMed
    1. Panda S, Antoch MP, Miller BH, Su AI, Schook AB, et al. (2002) Coordinated transcription of key pathways in the mouse by the circadian clock. Cell 109: 307–320. - PubMed

Publication types