. 2013 Dec 19:4:455.
doi: 10.3389/fimmu.2013.00455. eCollection 2013.

Inhibitory Receptor Expression Depends More Dominantly on Differentiation and Activation than "Exhaustion" of Human CD8 T Cells

Affiliations

Inhibitory Receptor Expression Depends More Dominantly on Differentiation and Activation than "Exhaustion" of Human CD8 T Cells

Amandine Legat et al. Front Immunol. .

Abstract

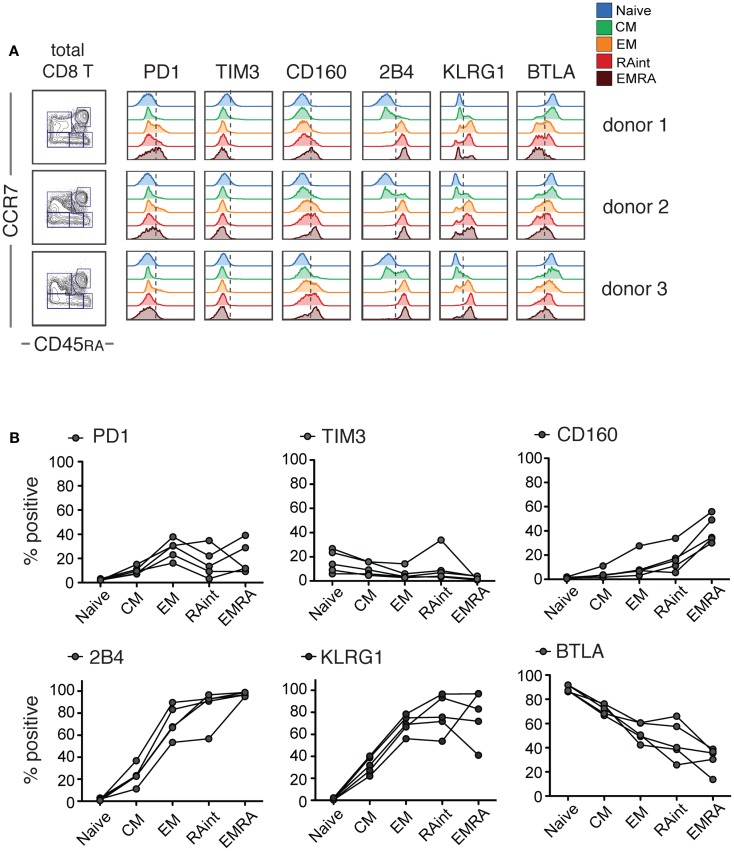
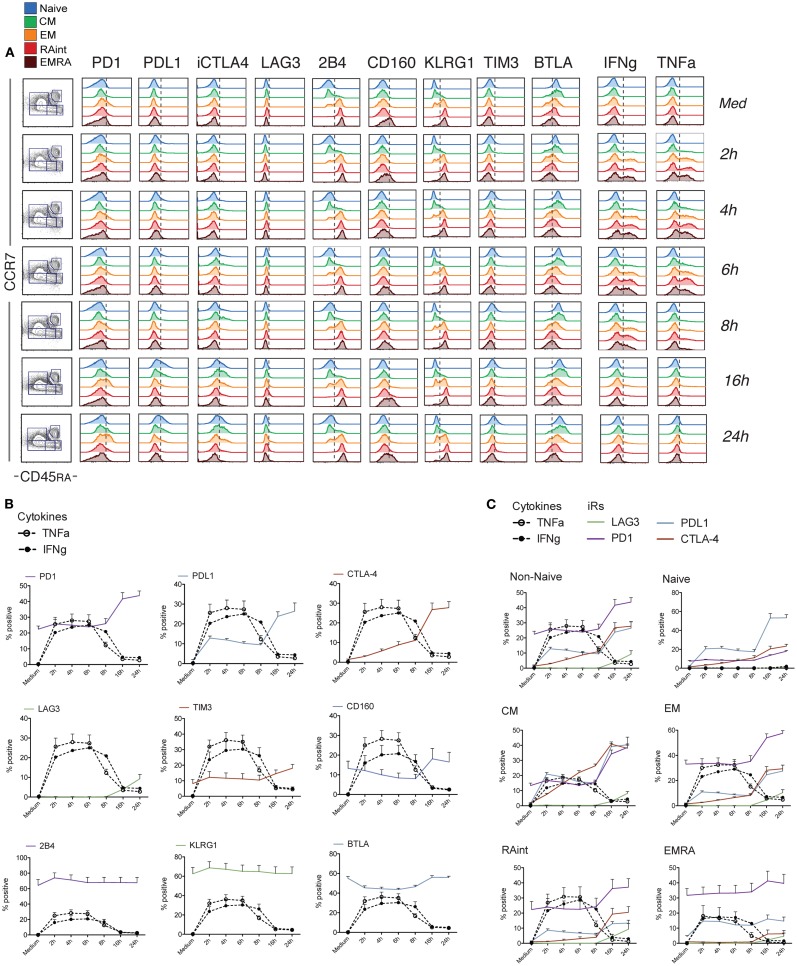
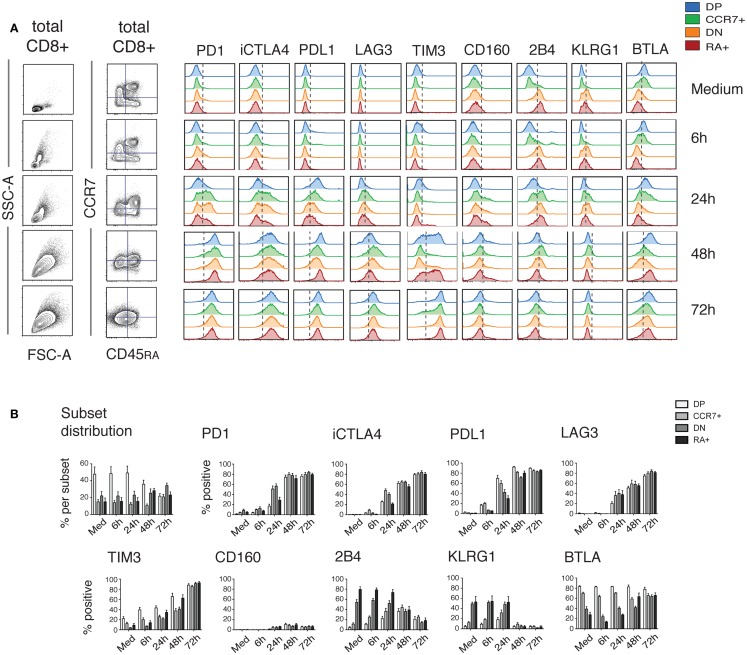
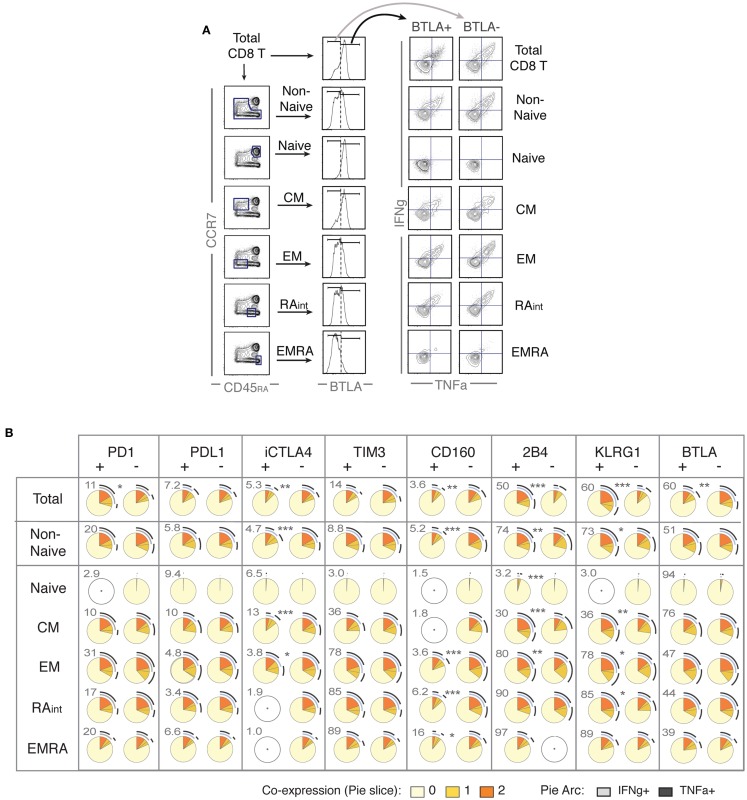
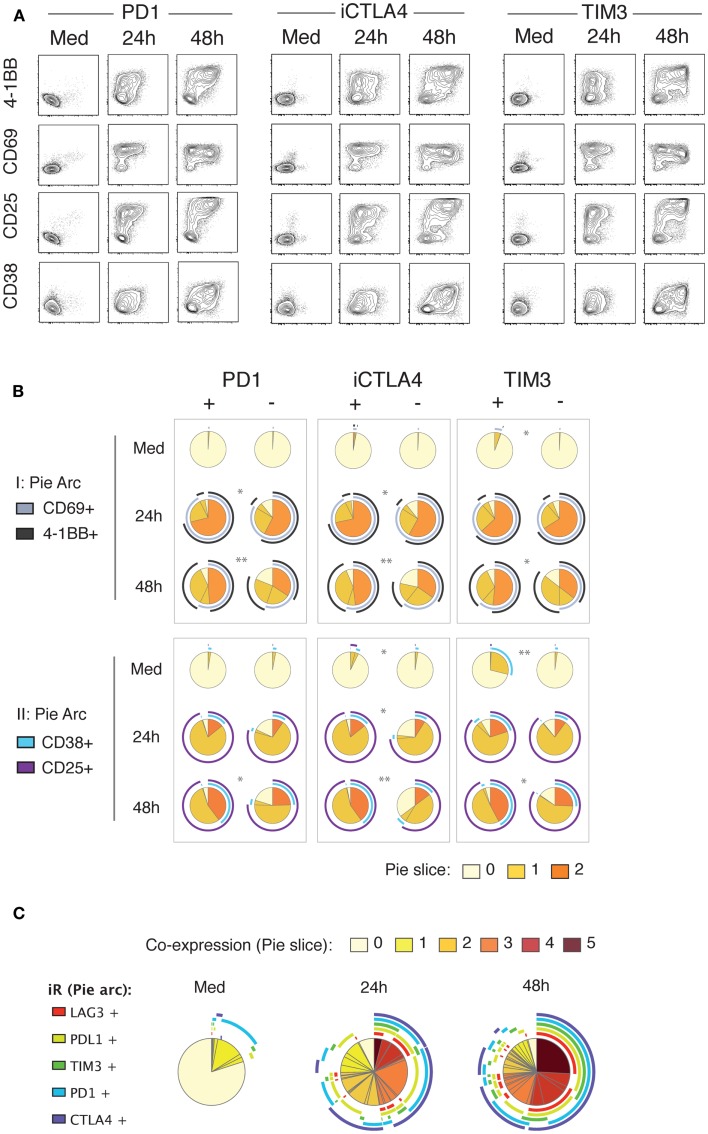
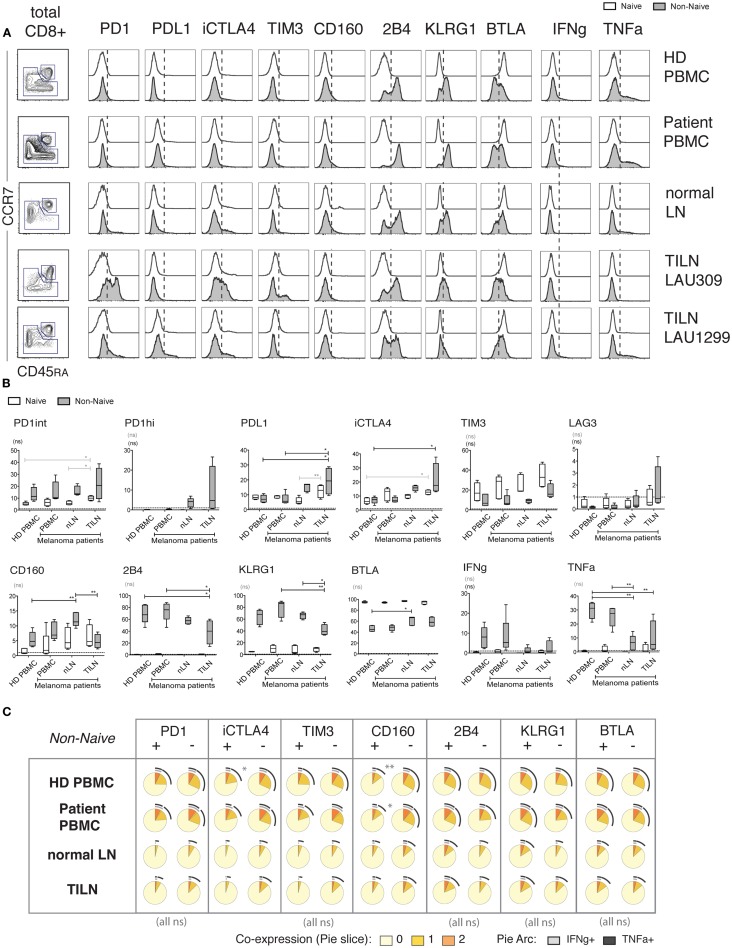
Under conditions of chronic antigen stimulation, such as persistent viral infection and cancer, CD8 T cells may diminish effector function, which has been termed "exhaustion." Expression of inhibitory Receptors (iRs) is often regarded as a hallmark of "exhaustion." Here we studied the expression of eight different iRs by CD8 T cells of healthy humans, including CTLA-4, PD1, TIM3, LAG3, 2B4, BTLA, CD160, and KLRG1. We show that many iRs are expressed upon activation, and with progressive differentiation to effector cells, even in absence of long-term ("chronic") antigenic stimulation. In particular, we evaluated the direct relationship between iR expression and functionality in CD8 T cells by using anti-CD3 and anti-CD28 stimulation to stimulate all cells and differentiation subsets. We observed a striking up-regulation of certain iRs following the cytokine production wave, in agreement with the notion that iRs function as a negative feedback mechanism. Intriguingly, we found no major impairment of cytokine production in cells positive for a broad array of iRs, as previously shown for PD1 in healthy donors. Rather, the expression of the various iRs strongly correlated with T cell differentiation or activation states, or both. Furthermore, we analyzed CD8 T cells from lymph nodes (LNs) of melanoma patients. Interestingly, we found altered iR expression and lower cytokine production by T cells from metastatic LNs, but also from non-metastatic LNs, likely due to mechanisms which are not related to exhaustion. Together, our data shows that expression of iRs per se does not mark dysfunctional cells, but is rather tightly linked to activation and differentiation. This study highlights the importance of considering the status of activation and differentiation for the study and the clinical monitoring of CD8 T cells.

Keywords: CD8 T cell; T cell exhaustion; activation; differentiation; inhibitory receptors.


Figures

Figure 1
Figure 1
IR profiles change with CD8 T cell differentiation. Resting CD8 T cells isolated from healthy donor PBMC were analyzed for the indicated inhibitory receptors (iRs) (these samples correspond to the medium controls from the experiments in Figure 2). Three examples are shown. (A). CCR7 versus CD45RA-based differentiation plot of total CD8 T cells and off-set overlay histograms for each iR comparing the differentiation subsets, gated as shown in detail in Figure S1 in Supplementary Material. Three representative donors are shown. (B). Quantification of A shown as percentage positive within each subset (N = 5).
Figure 2
Figure 2
Dynamics of iR expression relative to the cytokine production wave within 24 h of stimulation. CD8 T cells isolated from healthy donor PBMC were analyzed at different time-points after stimulation with anti-CD3 and anti-CD28 antibodies and analyzed for the various iRs together with TNFa and IFNg, as indicated (N = 5). (A). One representative example of the analysis, done as in Figure 1A. (B). Quantification showing the percentage positive cells for each iR, together with IFNg and TNFa, within total non-naive CD8 T cells (NB. Naive cells do not produce cytokines – Figure S2 in Supplementary Material). (C). Grouped quantification for the iRs that showed up-regulation, in Non-Naive cells or the various differentiation subsets as indicated.
Figure 3
Figure 3
Dynamics of iR expression over 3 days of stimulation. PBMC from healthy donors were stimulated for different time-periods with anti-CD3 and anti-CD28 antibodies. CD8 T cells were analyzed similarly to Figure 1 for the various iRs. (A). CCR7 versus CD45RA-based differentiation plot and FSC versus SSC plot of total CD8 T cells, as well as off-set overlay histograms for each iR comparing the various subsets as indicated. In order to analyze iRs during the development of an activated blasting population, we used a constant quadrant gating, based on the medium sample, for CCR7 and CD45RA. Despite the fact that the gating is obsolete by 72 h, this highlights the development of a homogeneous blast expressing various iRs. One representative example is shown. (B). Quantification showing the percentage positive cells for each iR (N = 5).
Figure 4
Figure 4
Positive expression of iRs does not necessarily mark lower cytokine production but can rather correlate with T cell differentiation. CD8 T cells from healthy donors were stimulated with anti-CD3 and anti-CD28 beads for 4 h, similarly as in Figure 2 (N = 15). (A). Analysis strategy to compare iR positive versus negative cells, depending on CD8 T cell differentiation. Total CD8 T cells or each differentiation subset (as indicated) was split into iR positive and iR negative cells, which were subsequently analyzed for cytokine production. (B) Pie charts showing the cytokine production in iR positive or negative cells, considering either in total CD8, in Non-Naïve, or in each of the differentiation subsets, as indicated in each row. Pie arcs and slices represent the percentage positive for IFNg and/or TNFa, as indicated in the legend. The numbers adjacent to the iR positive pies, above and to the left of each pie, indicate the % of iR positive cells within the differentiation gate considered. An empty gray circle means the population does not apply (i.e., only populations representing iR expression gates >3% were considered). The p-values shown apply to the comparison of iR positive versus iR negative counterparts (indicated in between pairs of pies that showed significance).
Figure 5
Figure 5
Up-regulation of iRs during stimulation strongly correlates with activation markers. Healthy donor PBMC were stimulated for 24 and 48 h with anti-CD3 and anti-CD28 antibodies. CD8 T cells were analyzed for co-expression of iRs and activation markers in two separate panels (I and II). (A). Representative plot of PD1, CTLA4 or TIM3 (x-axis) versus the four activation markers as indicated, gating was on non-naive CD8 T cells. (B). Quantification of the expression of activation markers in iR+ versus iR− counterparts (N = 5). (C). Co-expression of PD1, CTLA4, TIM3, PDL1, and TIM3 on non-naïve CD8 T cells.
Figure 6
Figure 6
Expression of iRs and cytokine production in human CD8 T cells from metastatic and non-metastatic lymph nodes differ from blood-derived T cells. CD8 T cells isolated from PBMC of healthy donors (N = 5), PBMC of melanoma patients (N = 5), non-metastatic LN (“normal LN”) of melanoma patients (N = 5) and TILN (N = 4) were stimulated for 4 h with aCD3 and aCD28 beads. (A). CCR7 versus CD45RA-based differentiation plot of total CD8 T cells, as well as off-set overlay histograms for each iR comparing Naïve and Non-naïve cells, as indicated. One representative example is shown for each, i.e., PBMC of healthy donor, PBMC of melanoma patient, and non-metastatic LN, and two distinct examples are shown for TILN. Naïve cells are shown in white histograms and non-naïve cells in gray histograms. (B). Quantification showing the percentage positive cells for each iR as well as for IFNg and TNFa amongst the indicated sample groups. p-Values were based on multiple comparisons using one-way ANOVA with Bonferroni correction. (C). Analysis of the expression of TNFa and IFNg in iR positive or negative cells, within non-naïve cells, amongst the indicated sample groups. Pie arcs and slices represent the percentage positive for IFNg and/or TNFa as indicated in the legend.

Similar articles

Cited by

References

    1. Chen L, Flies DB. Molecular mechanisms of T cell co-stimulation and co-inhibition. Nat Rev Immunol (2013) 13(4):227–4210.1038/nri3405 - DOI - PMC - PubMed
    1. Crawford A, Wherry EJ. The diversity of costimulatory and inhibitory receptor pathways and the regulation of antiviral T cell responses. Curr Opin Immunol (2009) 21(2):179–8610.1016/j.coi.2009.01.010 - DOI - PMC - PubMed
    1. Yi JS, Cox MA, Zajac AJ. T-cell exhaustion: characteristics, causes and conversion. Immunology (2010) 129(4):474–8110.1111/j.1365-2567.2010.03255.x - DOI - PMC - PubMed
    1. Wherry EJ. T cell exhaustion. Nat Immunol (2011) 12(6):492–910.1038/ni.2035 - DOI - PubMed
    1. Baitsch L, Baumgaertner P, Devêvre E, Raghav SK, Legat A, Barba L, et al. Exhaustion of tumor-specific CD8(+) T cells in metastases from melanoma patients. J Clin Invest (2011) 121(6):2350–6010.1172/JCI46102 - DOI - PMC - PubMed