. 2013:2013:296082.
doi: 10.1155/2013/296082. Epub 2013 Dec 11.

Antcin C from Antrodia cinnamomea Protects Liver Cells Against Free Radical-Induced Oxidative Stress and Apoptosis In Vitro and In Vivo through Nrf2-Dependent Mechanism

Affiliations

Antcin C from Antrodia cinnamomea Protects Liver Cells Against Free Radical-Induced Oxidative Stress and Apoptosis In Vitro and In Vivo through Nrf2-Dependent Mechanism

M Gokila Vani et al. Evid Based Complement Alternat Med. 2013.

Abstract

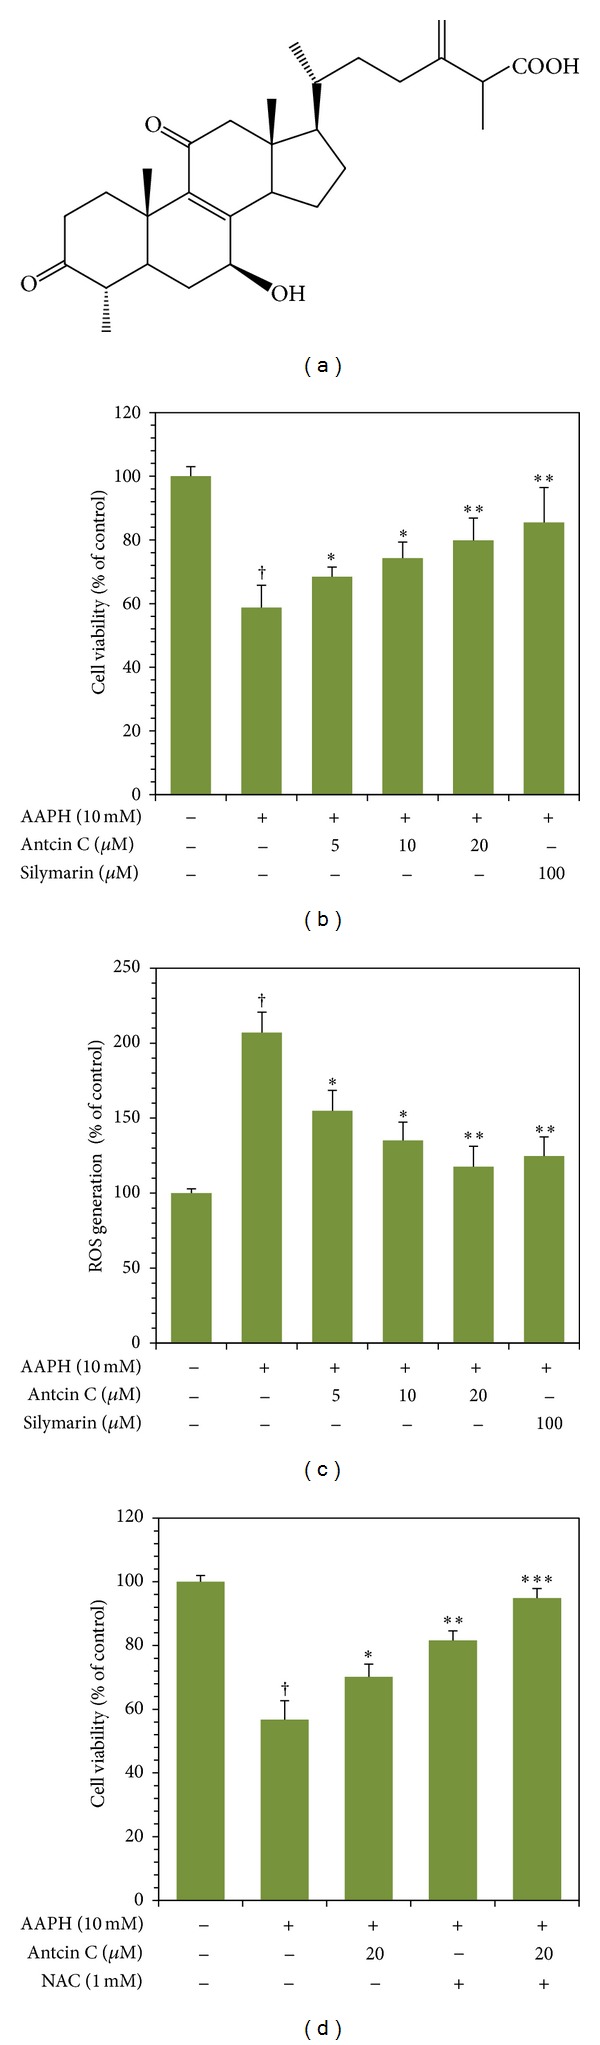
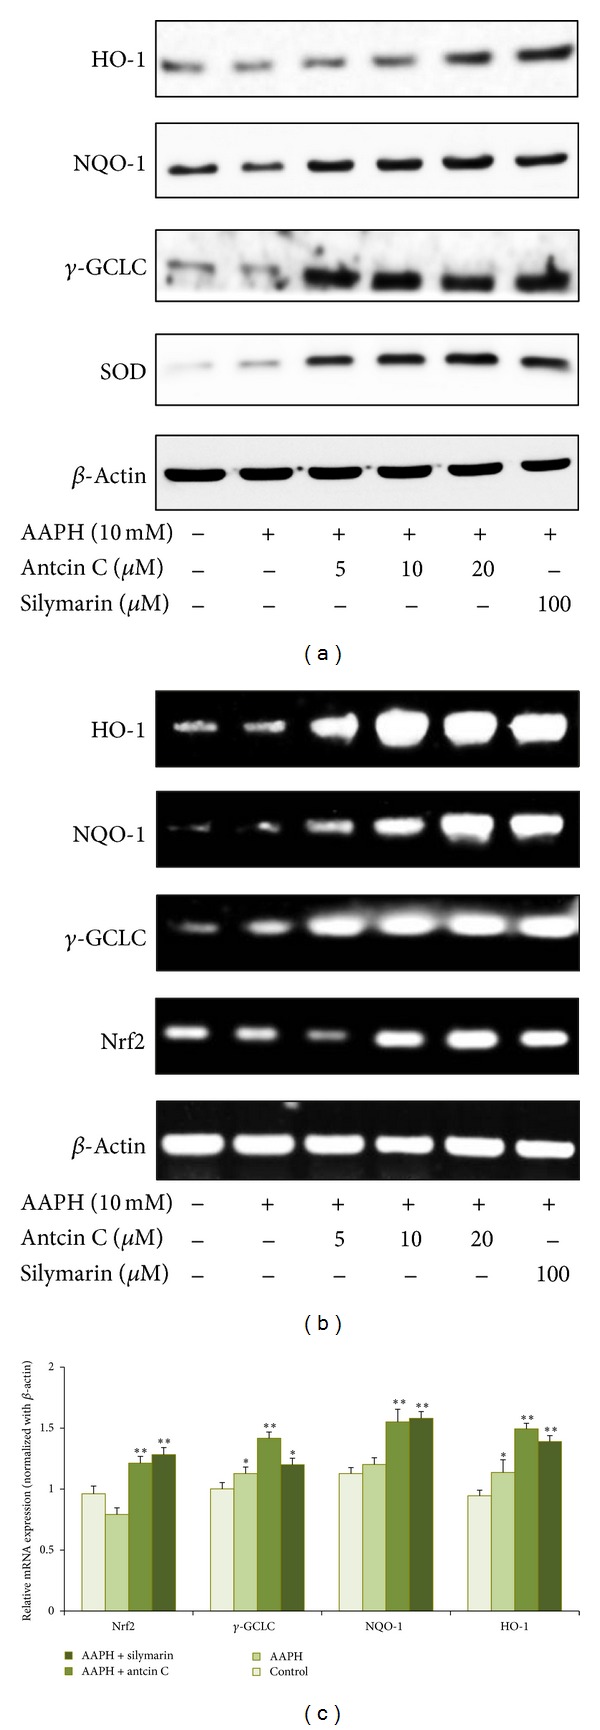
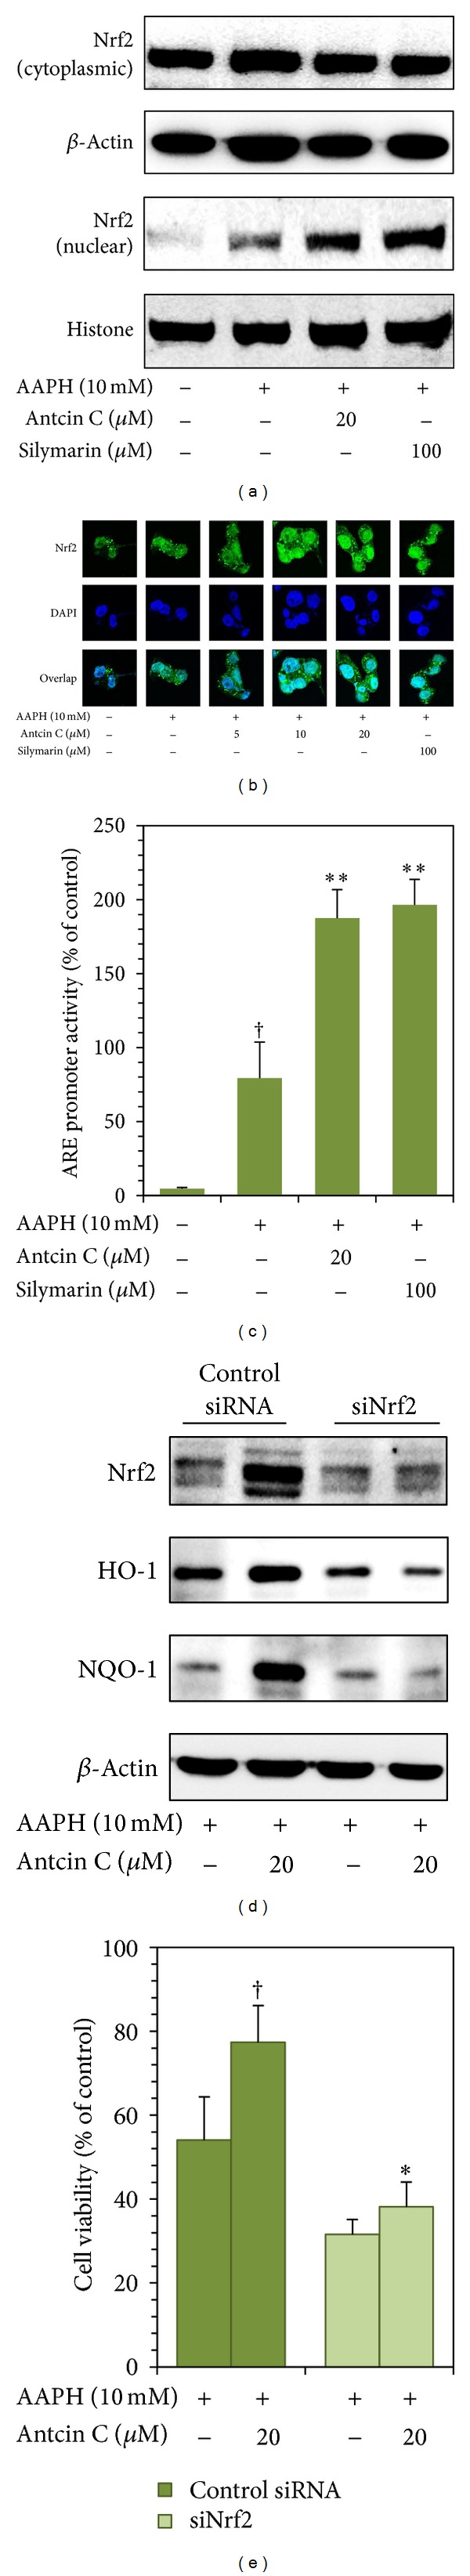
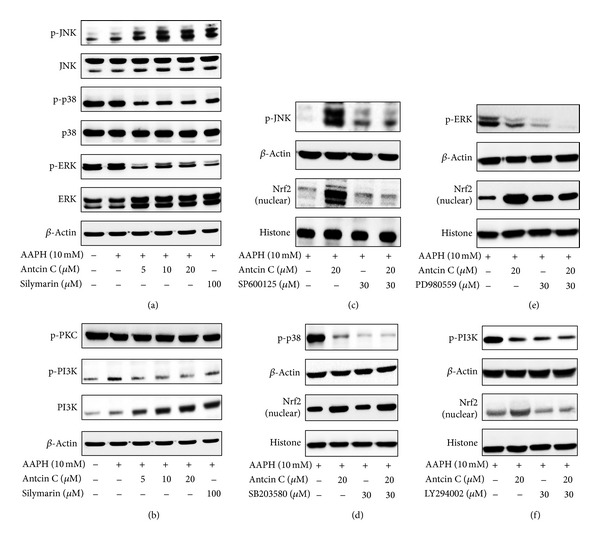
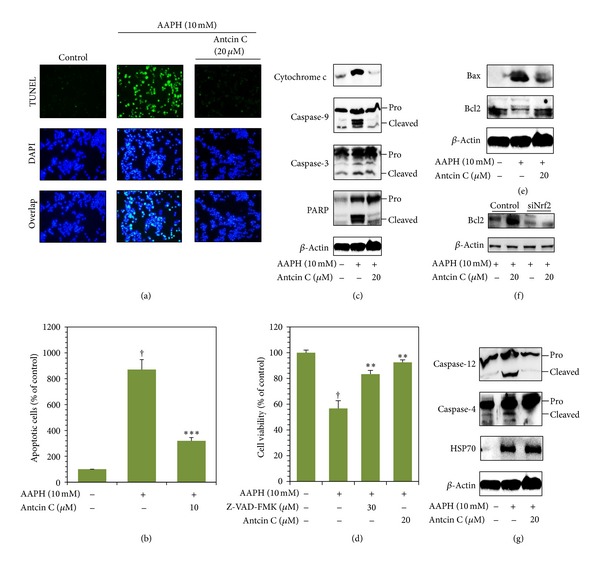
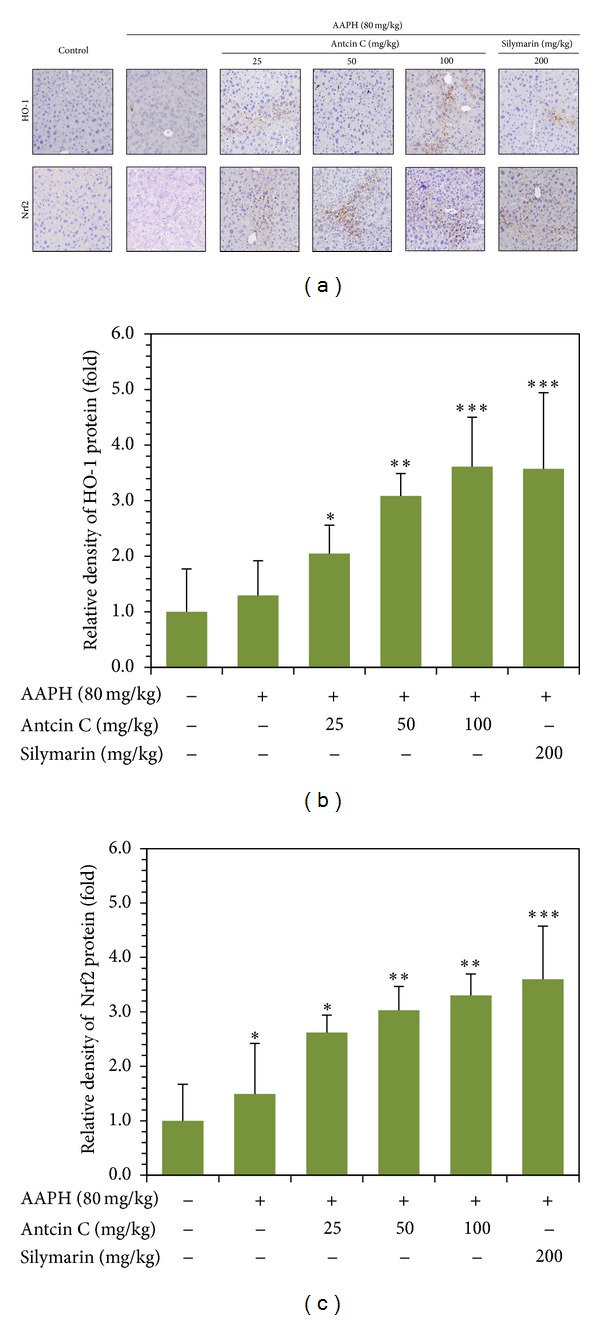
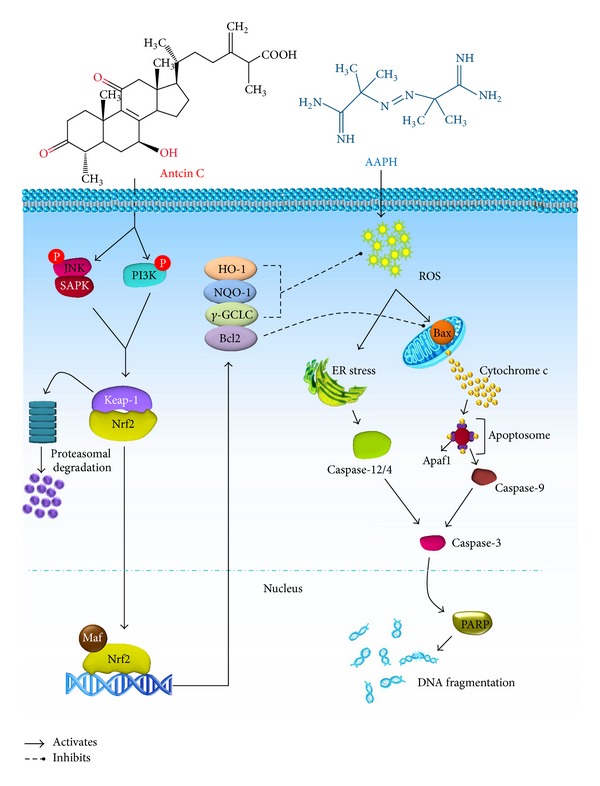
In this study, we investigated the cytoprotective effects of antcin C, a steroid-like compound isolated from Antrodia cinnamaomea against AAPH-induced oxidative stress and apoptosis in human hepatic HepG2 cells. Pretreatment with antcin C significantly protects hepatic cells from AAPH-induced cell death through the inhibition of ROS generation. Furthermore, AAPH-induced lipid peroxidation, ALT/AST secretion and GSH depletion was significantly inhibited by antcin C. The antioxidant potential of antcin C was correlated with induction of antioxidant genes including, HO-1, NQO-1, γ -GCLC, and SOD via transcriptional activation of Nrf2. The Nrf2 activation by antcin C is mediated by JNK1/2 and PI3K activation, whereas pharmacologic inhibition of JNK1/2 and PI3K abolished antcin C-induced Nrf2 activity. In addition, AAPH-induced apoptosis was significantly inhibited by antcin C through the down-regulation of pro-apoptotic factors including, Bax, cytochrome c, capase 9, -4, -12, -3, and PARP. In vivo studies also show that antcin C significantly protected mice liver from AAPH-induced hepatic injury as evidenced by reduction in hepatic enzymes in circulation. Further, immunocytochemistry analyses showed that antcin C significantly increased HO-1 and Nrf2 expression in mice liver tissues. These results strongly suggest that antcin C could protect liver cells from oxidative stress and cell death via Nrf2/ARE activation.


Figures

Figure 1
Figure 1
Protective effects of antcin C on AAPH-induced cell death and ROS generation in HepG2 cells. (a) Chemical structure of antcin C. (b) and (d) Cells were pretreated with increasing concentrations of antcin C (5–20 μM), silymarin (100 μM), or NAC (1 mM) for 2 h; then oxidative stress was induced by AAPH (10 mM) for 24 h. Cell viability was measured by MTT assay. Percentage of viable cells was calculated against that of control cells. (c) Cells were pretreated with antcin C (5–20 μM) or silymarin (100 μM) for 2 h, and then ROS generation was induced by AAPH (10 mM) for 30 min. The percentage of fluorescence intensity of the DCF stained cells was quantified using a fluorescence spectrophotometer as described in Materials and Methods. Values represent the mean ± SD of three independent experiments. *P < 0.05, **P < 0.01, and ***P < 0.001 were considered significant for sample versus AAPH. P < 0.05 was considered significant for control versus AAPH.
Figure 2
Figure 2
Antcin C induced antioxidant genes expression in AAPH-induced HepG2 cells. (a) HepG2 cells were preincubated with antcin C (5–20 μM) or silymarin (100 μM) for 2 h, and then exposed to AAPH (10 mM) for 24 h. Total cell lysates were prepared and subjected to western blot analysis to monitor the expression levels of antioxidant proteins, including HO-1, NQO-1, γ-GCLC, and SOD. β-actin served as an internal control. (b) The effect of antcin C on mRNA levels of antioxidant genes. HepG2 cells were pre-incubated with antcin C (5–20 μM) or silymarin (100 μM) for 2 h, and then exposed to AAPH (10 mM) for 6 h. The mRNA levels of HO-1, NQO-1, γ-GCLC were semiquantified by RT-PCR analyses. β-Actin was used as a loading control. (c) HepG2 cells were pre-incubated with antcin C (20 μM) or silymarin (100 μM) for 2 h, and then exposed to AAPH (10 mM) for 6 h. Q-PCR analysis was performed to monitor the expression levels of HO-1, NQO-1, γ-GCLC, and Nrf2 mRNA levels. Values represent the mean ± SD of three independent experiments. *P < 0.05, **P < 0.01, and ***P < 0.001 were considered significant for sample versus AAPH. P < 0.05 was considered significant for control versus AAPH.
Figure 3
Figure 3
Antcin C promotes transcriptional activation of Nrf2 in AAPH-induced HepG2 cells. (a) Cells were pretreated with antcin C (20 μM) or silymarin (100 μM) for 2 h, and then exposed to AAPH (10 mM) for 1 h. Nuclear and cytoplasmic lysates were prepared and subjected to western blot analysis. The accumulation of Nrf2 in the cytoplasm and the nucleus was monitored. (b) HepG2 cells were pretreated with antcin C (5–20 μM) or silymarin (100 μM) for 2 h, and then exposed to AAPH (10 mM) for 1 h. The protein expression levels of Nrf2 in AAPH-treated HepG2 cells were measured by immunofluorescence using Nrf2 specific primary and fluorescein isothiocyanate-conjugated secondary antibodies (green). The subcellular and nuclear distribution was photographed by fluorescence microscope. DAPI (1 μg/mL) was used to stain the nucleus. (c) HepG2 cells were transiently transfected with ARE plasmids by using lipofectamine and pre-incubated with antcin C (20 μM) or silymarin (100 μM) in the presence or absence of AAPH (10 mM) for 2 h. Cell lysates were mixed with luciferase reagents and quantified using an illuminometer. Relative ARE activity was calculated by dividing the relative luciferase unit (RLU) of treated cells by the RLU of untreated cells. Values represent the mean ± SD of three independent experiments. **P < 0.01 was considered significant for sample versus AAPH. P < 0.05 was considered significant for control versus AAPH. (d) HepG2 cells were transfected with a specific siRNA against Nrf2 or a nonsilencing control. After 24 h of transfection, the cells were incubated with or without antcin C (20 μM for 2 h) and were induced by AAPH (10 mM) for 2–24 h. Protein expression levels of HO-1, NQO-1, and Nrf2 were monitored by western blot analysis. Cell viability was determined by MTT assay. Values represent the mean ± SD of three independent experiments. *P < 0.05 was considered significant for AAPH versus sample in the control siRNA. P < 0.05 was considered significant for AAPH versus sample in the siNrf2 cells.
Figure 4
Figure 4
Effects of antcin C on AAPH-induced MAPK activation in HepG2 cells. ((a)–(d)) Cells were pretreated with antcin C (5–20 μM) or silymarin (100 μM) or MAPK inhibitors (30 μM) for 2 h, then exposed to AAPH (10 mM) for 15 min-1 h. Total cell lysates or the nuclear fraction were prepared and subjected to western blot analysis. Phosphorylated and nonphosphorylated forms of p38 MAPK, JNK1/2 and ERK1/2, PKC, and PI3K proteins were examined. β-actin was used as a loading control.
Figure 5
Figure 5
Antcin C protects HepG2 cells from AAPH-induced apoptosis. (a) The DNA fragmentation in AAPH-induced HepG2 cells was determined by TUNEL assay as described in Materials and Methods. The average number of TUNEL-positive cells in microscopic fields (magnification ×200) from three separate samples. (b) Percentages of apoptotic cells were determined by the number of TUNEL positive cells compared to the control. Values represent the mean ± SD of three independent experiments. ***P < 0.001 was considered significant for AAPH versus sample. P < 0.001 was considered significant for control versus AAPH. ((c), (e), (f)) HepG2 cells were pretreated with antcin C (20 μM) for 2 h, and then exposed to AAPH for 30 min. The effects of antcin C on AAPH-induced cytosolic cytochrome c, caspase 9, caspase 3, PARP, Bcl-2, and Bax (mitochondrial pathway) protein levels were examined by immunoblotting. (g) Caspase 4, caspase 12, and HSP70 (ER stress pathway) was examined using western blot analysis. (d) Cells were pretreated with antcin C with or without caspase-3 inhibitor Z-VAD-FMK (30 μM) for 2 h, and then cell death was induced by AAPH for 24 h. Cell viability was determined by MTT assay. Values represent the mean ± SD of three independent experiments. **P < 0.01 was considered significant for AAPH versus samples. P < 0.01 was considered significant for control versus AAPH.
Figure 6
Figure 6
Antcin C upregulates antioxidant genes in AAPH-challenged liver tissues. Mice were pretreated with antcin C (25–200 mg/kg) or silymarin (100 mg/kg) for 5 days, and then challenged with a single dose of AAPH (80 mg/kg). Mice were sacrificed, and the liver sections were subjected to immunohistochemistry to analyse the protein expression levels of HO-1, NQO-1, and Nrf2 using specific antibodies. The relative intensity of antibody positive staining cells was quantified by Image-Pro Plus software. The results are presented as the mean ± SD of three independent experiments. *P < 0.05, **P < 0.01, and ***P < 0.001 were considered significant for sample versus control.
Figure 7
Figure 7
Schematic representation of antcin C-induced upregulation of antioxidative gene expression via the Nrf2/ARE signaling pathway and suppression of AAPH-induced apoptosis in human hepatic HepG2 cells.

References

    1. Jagetia GC, Reddy TK, Venkatesha VA, Kedlaya R. Influence of naringin on ferric iron induced oxidative damage in vitro . Clinica Chimica Acta. 2004;347(1-2):189–197. - PubMed
    1. Ghaffari H, Ghassam BJ, Prakash H. Hepatoprotective and cytoprotective properties of Hyptis suaveolens against oxidative stress-induced damage by CCl4 and H2O2 . Asian Pacific Journal of Tropical Medicine. 2012;5(11):868–874. - PubMed
    1. Senthil Kumar KJ, Liao J-W, Xiao J-H, Gokila Vani M, Wang S-Y. Hepatoprotective effect of lucidone against alcohol-induced oxidative stress in human hepatic HepG2 cells through the up-regulation of HO-1/Nrf-2 antioxidant genes. Toxicology in Vitro. 2012;26(5):700–708. - PubMed
    1. Wu D, Zhai Q, Shi X. Alcohol-induced oxidative stress and cell responses. Journal of Gastroenterology and Hepatology. 2006;21(supplement 3):S26–S29. - PubMed
    1. Surh Y-J. Cancer chemoprevention with dietary phytochemicals. Nature Reviews Cancer. 2003;3(10):768–780. - PubMed