

How the motility pattern of bacteria affects their dispersal and chemotaxis
- PMID: 24391710
- PMCID: PMC3876982
- DOI: 10.1371/journal.pone.0081936
How the motility pattern of bacteria affects their dispersal and chemotaxis
Erratum in
- PLoS One. 2014;9(3):e92348
Abstract
Most bacteria at certain stages of their life cycle are able to move actively; they can swim in a liquid or crawl on various surfaces. A typical path of the moving cell often resembles the trajectory of a random walk. However, bacteria are capable of modifying their apparently random motion in response to changing environmental conditions. As a result, bacteria can migrate towards the source of nutrients or away from harmful chemicals. Surprisingly, many bacterial species that were studied have several distinct motility patterns, which can be theoretically modeled by a unifying random walk approach. We use this approach to quantify the process of cell dispersal in a homogeneous environment and show how the bacterial drift velocity towards the source of attracting chemicals is affected by the motility pattern of the bacteria. Our results open up the possibility of accessing additional information about the intrinsic response of the cells using macroscopic observations of bacteria moving in inhomogeneous environments.
Conflict of interest statement
Figures
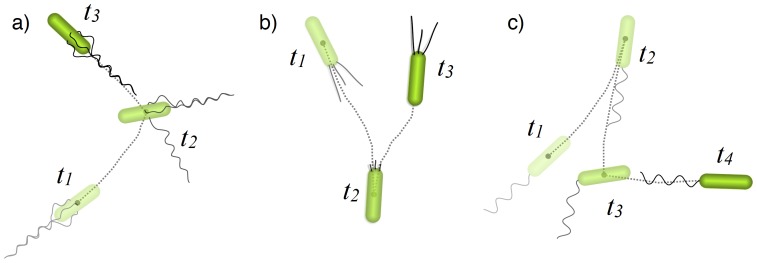
 indicate the sequence of these events. An average turning angle after tumbling in E. coli bacteria is
  (a), whereas it is an almost perfect reversal of
  for many marine bacteria, or cells with twitching motility due to cell appendages, called pili (b). V. alginolyticus (c) alternates reversals (at
  ) with randomizing flicks (at
  ) with an average turning angle of
  .
.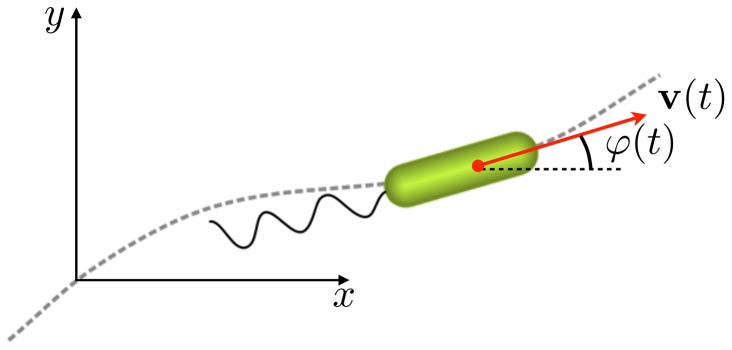
 moves at constant speed
  . The angle
  between the velocity vector
  and the
  axis defines the direction of cell motion.
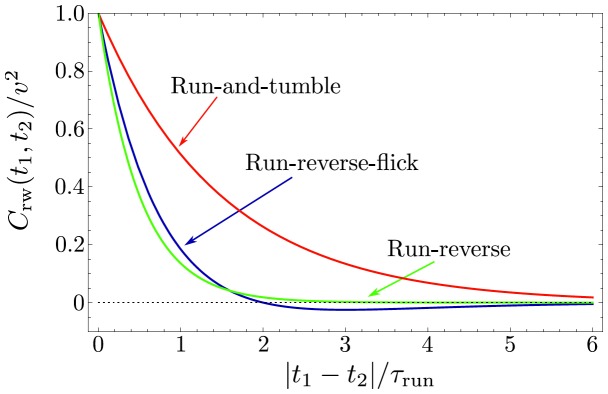
 is plotted as a function of dimensionless time
  . The curves are shown for run-and-tumble of E. coli with persistence parameter
  (red), run-reverse with
  (green), and run-reverse-flick with alternating
  and
and  (blue). The analytical expressions are given in Eqs. (12) and (21), respectively.
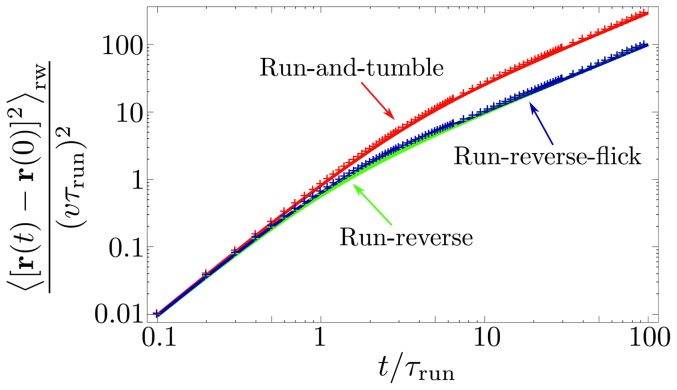
 correspond to E. coli's run-and-tumble with
  (red), run-reverse with
  (green), and run-reverse-flick with alternating
  and
and  (blue). The analytical expressions are given in Eqs. (13) and (22), respectively. The crosses are obtained from numerical simulations and fully agree with the analytical results.
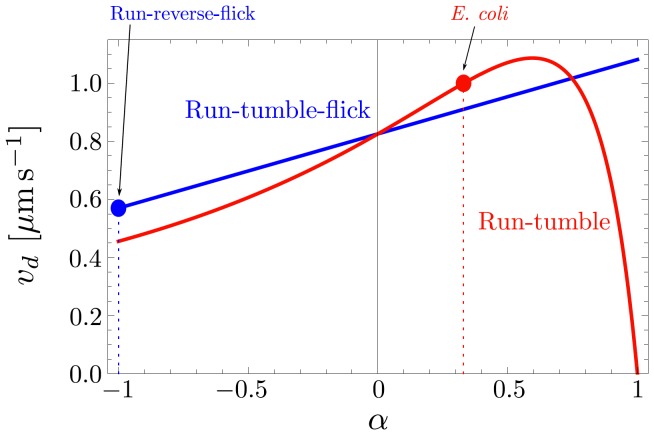
 with
with  ,
,  ,
,  , and
, and  .
.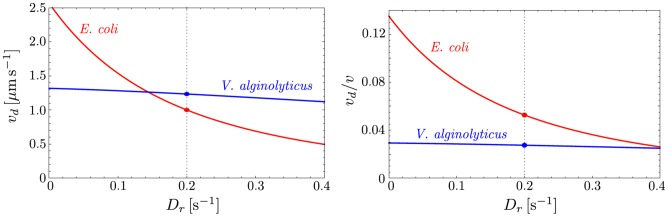
 ; on the right, the chemotactic drift is normalized by the swimming speed as
  and coincides with the chemotactic index.
References
-
- Hall-Stoodley L, Costerton JW, Stoodley P (2002) Bacterial biofilms: from the natural environment to infectious diseases. Nat Rev Microbiol 2: 95–108. - PubMed
-
- O'Toole G, Kaplan HB, Kolter R (2000) Biofilm formation as microbial development. Annu Rev Microbiol 54: 49–79. - PubMed
-
- Eisenbach M (2004) Chemotaxis. London: Imperial College Press, 1 edition.
Publication types
MeSH terms
LinkOut - more resources
Full Text Sources
Other Literature Sources
