

RNA sequencing of the exercise transcriptome in equine athletes
- PMID: 24391776
- PMCID: PMC3877044
- DOI: 10.1371/journal.pone.0083504
RNA sequencing of the exercise transcriptome in equine athletes
Abstract
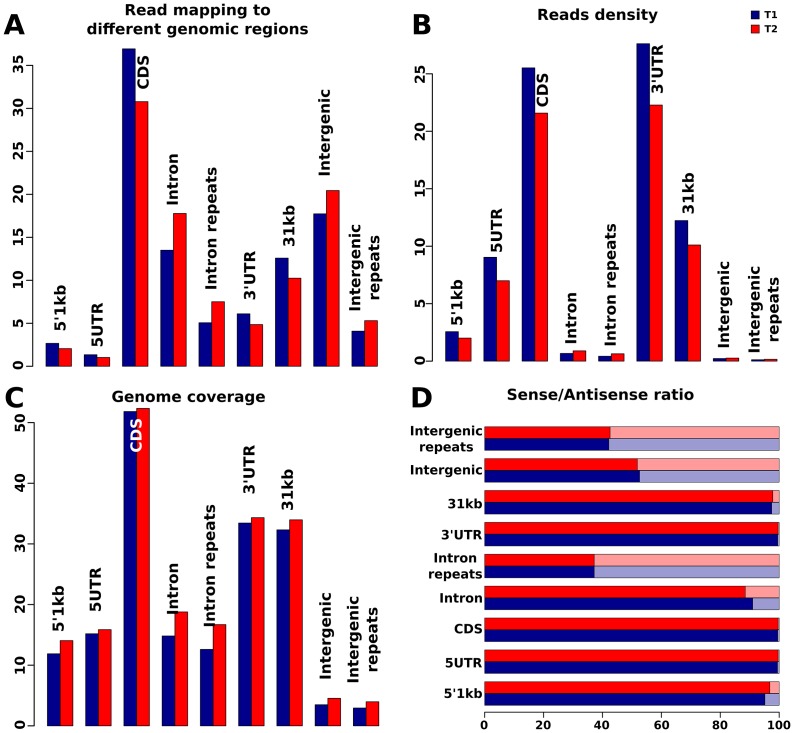
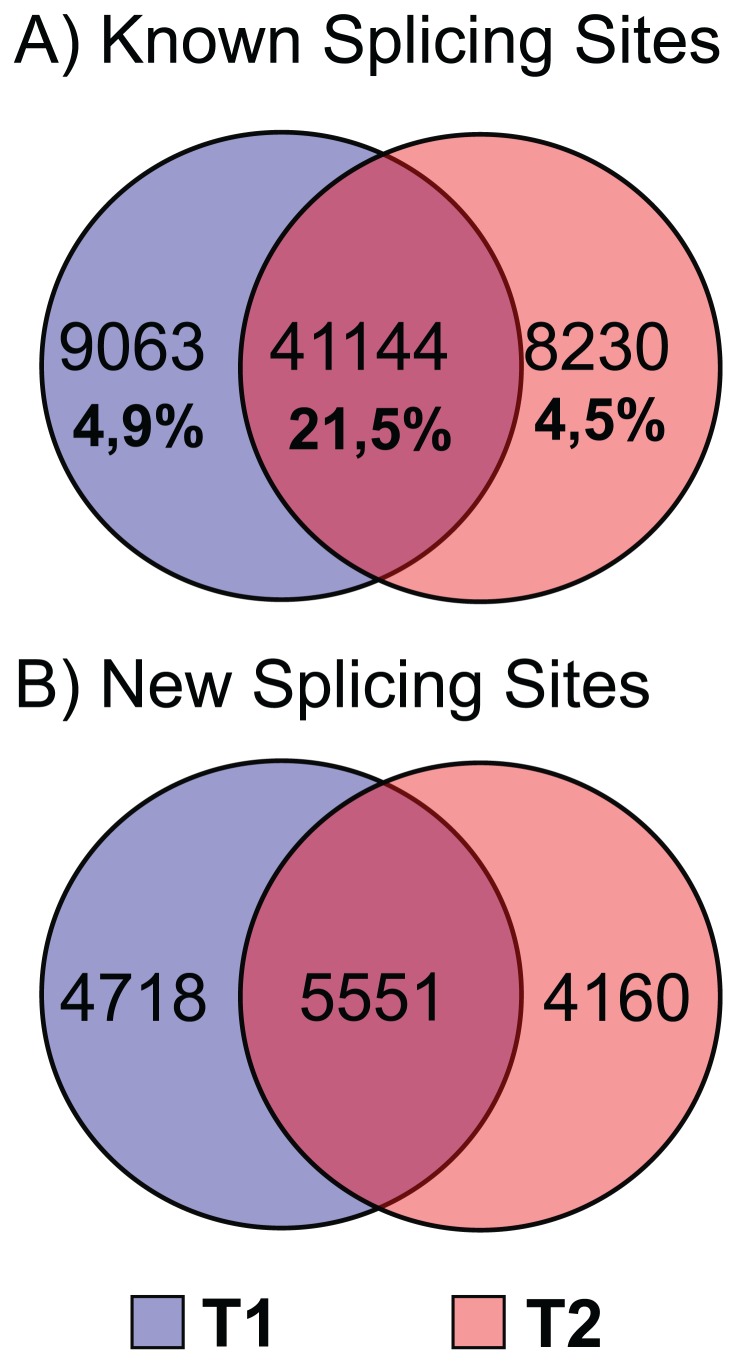
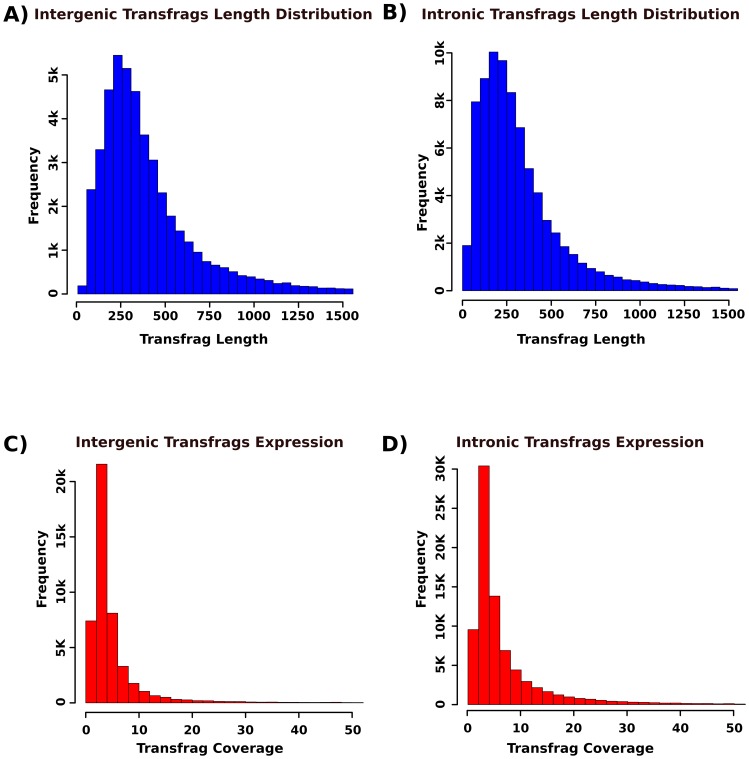
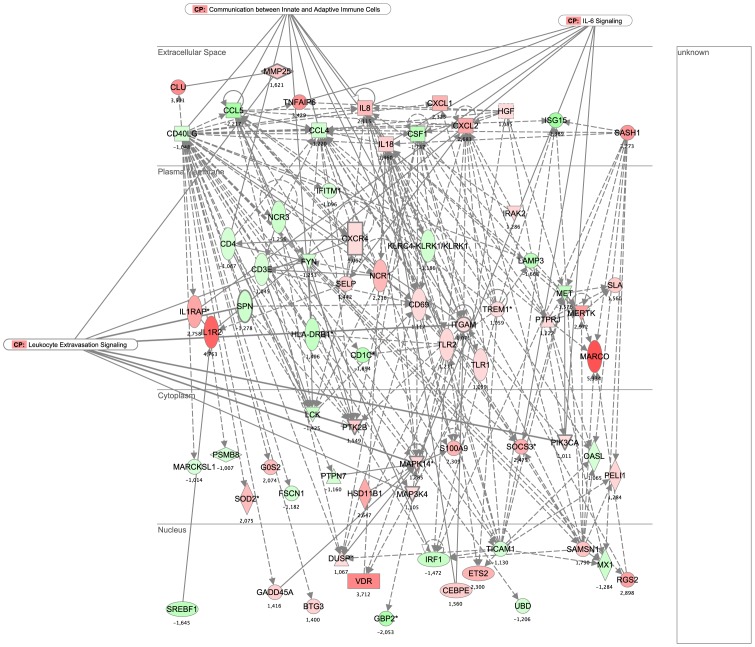
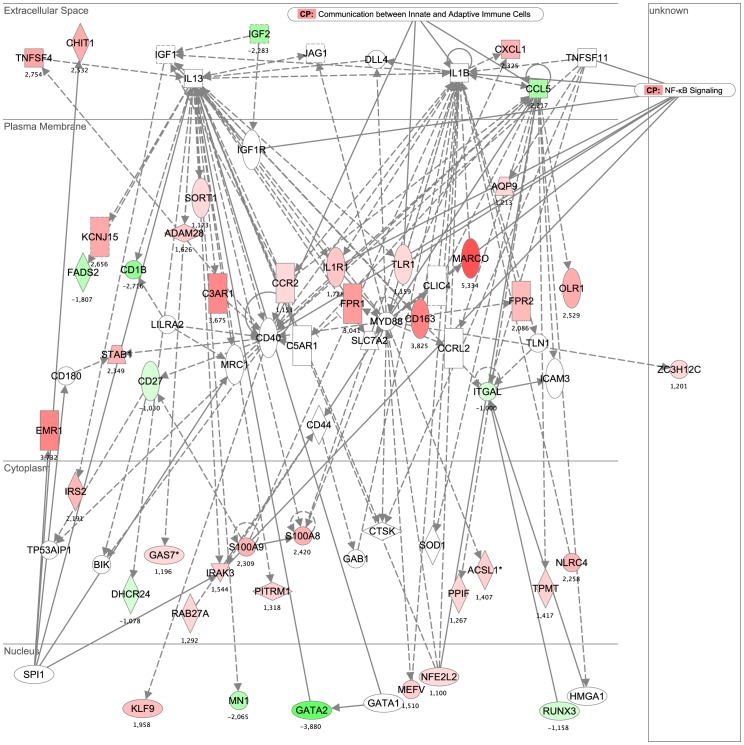
The horse is an optimal model organism for studying the genomic response to exercise-induced stress, due to its natural aptitude for athletic performance and the relative homogeneity of its genetic and environmental backgrounds. Here, we applied RNA-sequencing analysis through the use of SOLiD technology in an experimental framework centered on exercise-induced stress during endurance races in equine athletes. We monitored the transcriptional landscape by comparing gene expression levels between animals at rest and after competition. Overall, we observed a shift from coding to non-coding regions, suggesting that the stress response involves the differential expression of not annotated regions. Notably, we observed significant post-race increases of reads that correspond to repeats, especially the intergenic and intronic L1 and L2 transposable elements. We also observed increased expression of the antisense strands compared to the sense strands in intronic and regulatory regions (1 kb up- and downstream) of the genes, suggesting that antisense transcription could be one of the main mechanisms for transposon regulation in the horse under stress conditions. We identified a large number of transcripts corresponding to intergenic and intronic regions putatively associated with new transcriptional elements. Gene expression and pathway analysis allowed us to identify several biological processes and molecular functions that may be involved with exercise-induced stress. Ontology clustering reflected mechanisms that are already known to be stress activated (e.g., chemokine-type cytokines, Toll-like receptors, and kinases), as well as "nucleic acid binding" and "signal transduction activity" functions. There was also a general and transient decrease in the global rates of protein synthesis, which would be expected after strenuous global stress. In sum, our network analysis points toward the involvement of specific gene clusters in equine exercise-induced stress, including those involved in inflammation, cell signaling, and immune interactions.
Conflict of interest statement
Figures
References
-
- Art T, Franck T, Gangl M, Votion D, Kohnen S, et al. (2006) Plasma concentrations of myeloperoxidase in endurance and 3-day event horses after a competition. Equine Vet J Suppl: 298–302. - PubMed
-
- Capomaccio S, Cappelli K, Barrey E, Felicetti M, Silvestrelli M, et al. (2010) Microarray analysis after strenuous exercise in peripheral blood mononuclear cells of endurance horses. Anim Genet 41: 166–175. - PubMed
-
- Capomaccio S, Verini-Supplizi A, Galla G, Vitulo N, Barcaccia G, et al. (2010) Transcription of LINE-derived sequences in exercise-induced stress in horses. Anim Genet 41: 23–27. - PubMed
Publication types
MeSH terms
Substances
LinkOut - more resources
Full Text Sources
Other Literature Sources
