. 2013 Dec 31;8(12):e84459.
doi: 10.1371/journal.pone.0084459. eCollection 2013.

A gene island with two possible configurations is involved in chromatic acclimation in marine Synechococcus

Affiliations

A gene island with two possible configurations is involved in chromatic acclimation in marine Synechococcus

Florian Humily et al. PLoS One. .

Abstract

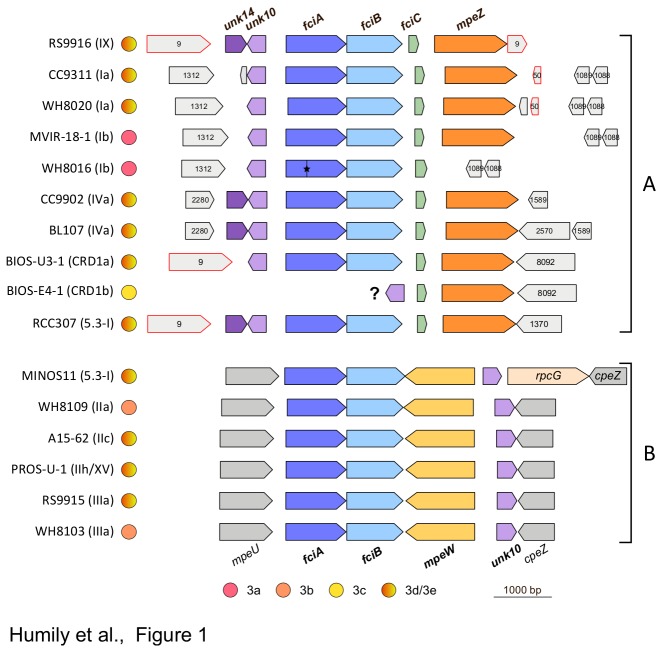
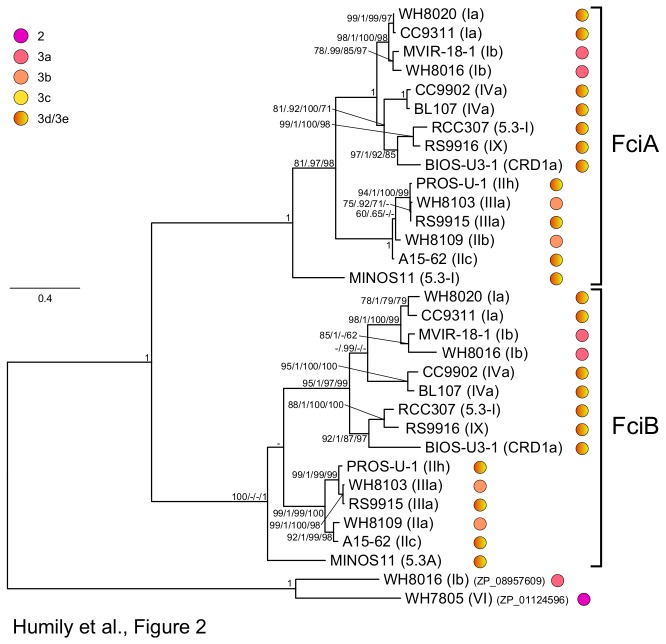
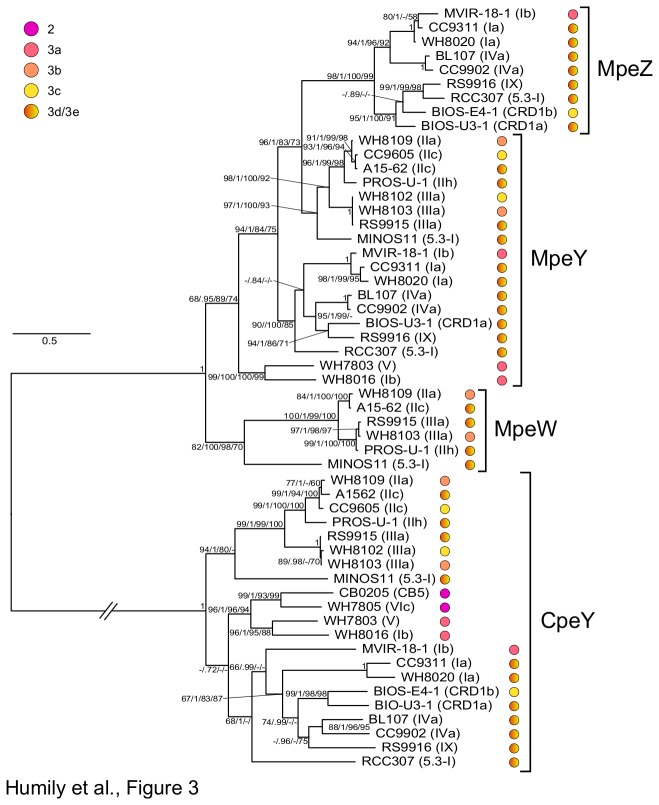
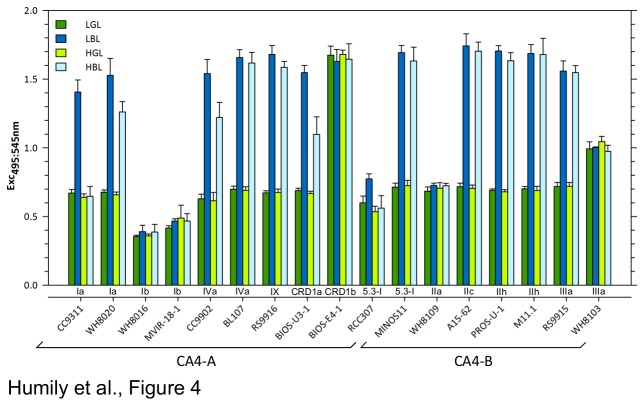
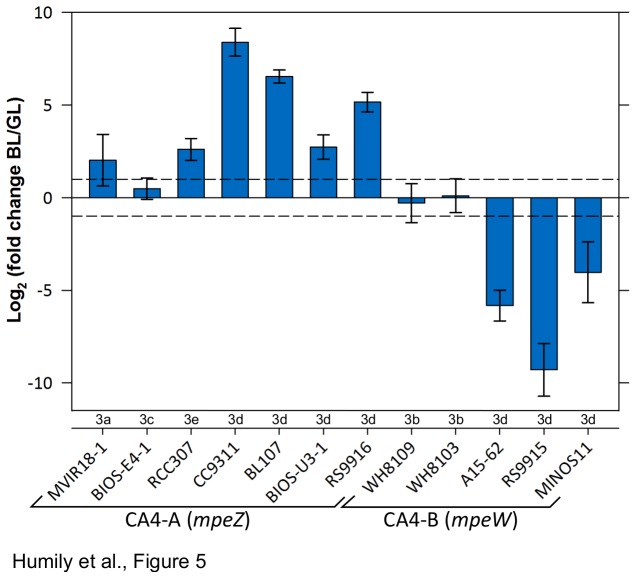
Synechococcus, the second most abundant oxygenic phototroph in the marine environment, harbors the largest pigment diversity known within a single genus of cyanobacteria, allowing it to exploit a wide range of light niches. Some strains are capable of Type IV chromatic acclimation (CA4), a process by which cells can match the phycobilin content of their phycobilisomes to the ambient light quality. Here, we performed extensive genomic comparisons to explore the diversity of this process within the marine Synechococcus radiation. A specific gene island was identified in all CA4-performing strains, containing two genes (fciA/b) coding for possible transcriptional regulators and one gene coding for a phycobilin lyase. However, two distinct configurations of this cluster were observed, depending on the lineage. CA4-A islands contain the mpeZ gene, encoding a recently characterized phycoerythrobilin lyase-isomerase, and a third, small, possible regulator called fciC. In CA4-B islands, the lyase gene encodes an uncharacterized relative of MpeZ, called MpeW. While mpeZ is expressed more in blue light than green light, this is the reverse for mpeW, although only small phenotypic differences were found among chromatic acclimaters possessing either CA4 island type. This study provides novel insights into understanding both diversity and evolution of the CA4 process.


Conflict of interest statement

Competing Interests: The authors have declared that no competing interests exist.

Figures

Figure 1
Figure 1. Gene content and genomic context of the two types of CA4 gene islands found in marine Synechococcus genomes.
The CA4-A island can be found at different locations of the genome (though the context is the same within a given clade), whereas the CA4-B island is always located in the main phycobilisome region between mpeU and cpeZ genes. The gene size and organization are represented to scale (scale bar = 1000 bp) and all regions aligned with regard to the fciA gene (except for BIOS-E4-1, aligned on mpeZ of BIOS-U3-1). Genes included in CA4 regions are shown in color and orthologs are indicated with the same color. Short CA4 genes of unknown function are named according to [7], with unk14 and fciC being novel genes, specific of the CA4-A region. Genes found in the immediate vicinity of CA4 regions (shown in grey) are designated either by their gene names or their cluster number in the Cyanorak v2.0 database of orthologous sequences (http://www.sb-roscoff.fr/Phyto/cyanorak/; with the prefix CK_ being omitted). One stop codon interrupting WH8016 fciA is indicated by a star. The phylogenetic affiliation of strains, as reported in previous studies (see text), is mentioned between brackets. The pigment type is indicated by circles bi-colored for strains that chromatically adapt and uni-colored for those that do not (see Table 1 for details). Hotspots for DNA recombination, hli (Cluster CK_00000050) and psbA (Cluster CK_00000009), are bordered by a red line.
Figure 2
Figure 2. Maximum likelihood analysis of AraC-like proteins (289 aa positions) from marine Synechococcus.
For each strain, the phylogenetic affiliation is mentioned between brackets and the pigment type is indicated by colored circles (see Table 1 for details). Series of four numbers shown at nodes correspond to bootstrap values for ML analyses, Bayesian posterior probabilities (PP, ranging between 0 and 1), and bootstrap values for Neighbor-Joining and Parsimony methods, respectively. Only values higher than 0.60 for PP and 60% for bootstrap values are shown on the phylogenetic tree. The scale bar represents 0.4 substitutions per amino acid.
Figure 3
Figure 3. Maximum likelihood analysis of four phycobilin lyase sequences of the E/F clan (380 aa positions) from marine Synechococcus.
For each strain, the phylogenetic affiliation is mentioned between brackets and the pigment type is indicated by colored circles (see Table 1 for details). Series of four numbers shown at nodes correspond to bootstrap values for ML analyses, Bayesian posterior probabilities (PP, ranging between 0 and 1), and bootstrap values for Neighbor-Joining and Parsimony methods, respectively. Only values higher than 0.60 for PP and 60% for bootstrap values are shown on the phylogenetic tree. The scale bar represents 0.6 substitutions per amino acid. The branch bearing the CpeY cluster was shortened for readability (its full length initially was 3.85 substitutions per amino acid).
Figure 4
Figure 4. Average Exc495:545 ratios of CA4 genes-containing Synechococcus strains acclimated to blue light (BL) and green light (GL) at two different irradiances (20 and 75 µmol photons m-2 s-1).
Low and high light conditions are shown respectively by dark and light colors (blue or green bars indicating BL and GL, respectively). A minimum of 5 replicates were used to calculate the mean and standard deviation.
Figure 5
Figure 5. Differential expression of mpeW or mpeZ genes in Synechococcus cultures acclimated to BL vs.
GL as measured by real time PCR (20 µmol photons m-2 s-1 in both conditions). Mean and standard deviation were calculated from 3 biological replicates. Only differential transcript levels above or below the dotted lines (log2(FC) > 1 or <-1) were considered as significant.
Figure 6
Figure 6. Phenotypic variability of chromatic acclimation in marine Synechococcus.
Temporal changes of the Exc495:545 after shifts from BL to GL (and vice versa) at two irradiances: LL (circles; 20 µmol photons m-2 s-1) and HL (triangles; 75 µmol photons m-2 s-1). The color (blue or green) of lines and symbols matches the ambient light color under which cultures were shifted at time zero. Error bars indicate standard deviation for two biological replicates. Four distinct CA4 phenotypic groups were observed. (A,B) Group 1 strains: MINOS11, A15-62, PROS-U-1, M11.1 and RS9915; (C,D) group 2: BIOS-U3-1, CC9311, WH8020, CC9902 and RS9916; (E,F) group 3: BL107 and CC9902; (G,H): group 4 : RCC307. Note the different x-axis scale for BL107.
Figure 7
Figure 7. Correlations between growth rate (µ, days) and half maximal acclimation time (T50, days) for twelve Synechococcus strains.
Shifts to another light quality (BL to GL and vice versa) were performed under two light intensities. LL and HL correspond respectively to 20 and 75 µmol photons m-2 s-1 of BL or GL. Data correspond to two biological replicates for each strain and each light condition.

References

    1. Kirk JTO (1994) Light and photosynthesis in aquatic ecosystems. Cambridge, UK: Cambridge University Press.
    1. Morel A, Gentili B, Claustre H, Babin M, Bricaud A, et al. (2007) Optical properties of the" clearest" natural waters. Limnol Oceanogr 52: 217-229
    1. Sidler WA (1994) Phycobilisome and phycobiliprotein structures. Molecular Biology of Cyanobacteria: 139-216.
    1. Adir N (2005) Elucidation of the molecular structures of components of the phycobilisome: reconstructing a giant. Photosynth Res 85: 15-32. doi:10.1007/s11120-004-2143-y. PubMed: 15977057. - DOI - PubMed
    1. MacColl R (1998) Cyanobacterial phycobilisomes. J Struct Biol 124: 311-334. doi:10.1006/jsbi.1998.4062. PubMed: 10049814. - DOI - PubMed

Publication types

MeSH terms

LinkOut - more resources