

Imaging-based biomarkers of cognitive performance in older adults constructed via high-dimensional pattern regression applied to MRI and PET
- PMID: 24392010
- PMCID: PMC3877379
- DOI: 10.1371/journal.pone.0085460
Imaging-based biomarkers of cognitive performance in older adults constructed via high-dimensional pattern regression applied to MRI and PET
Abstract
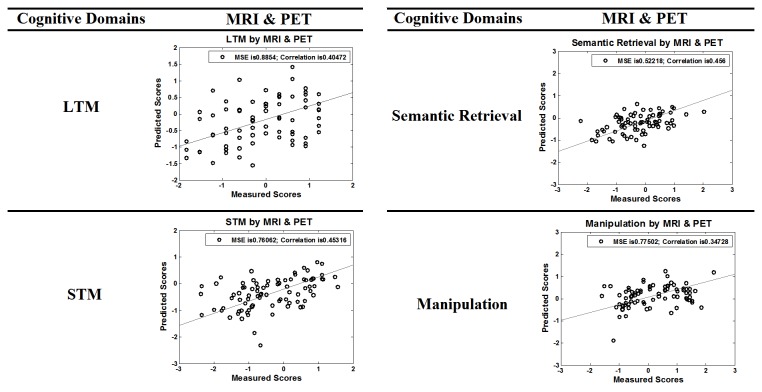
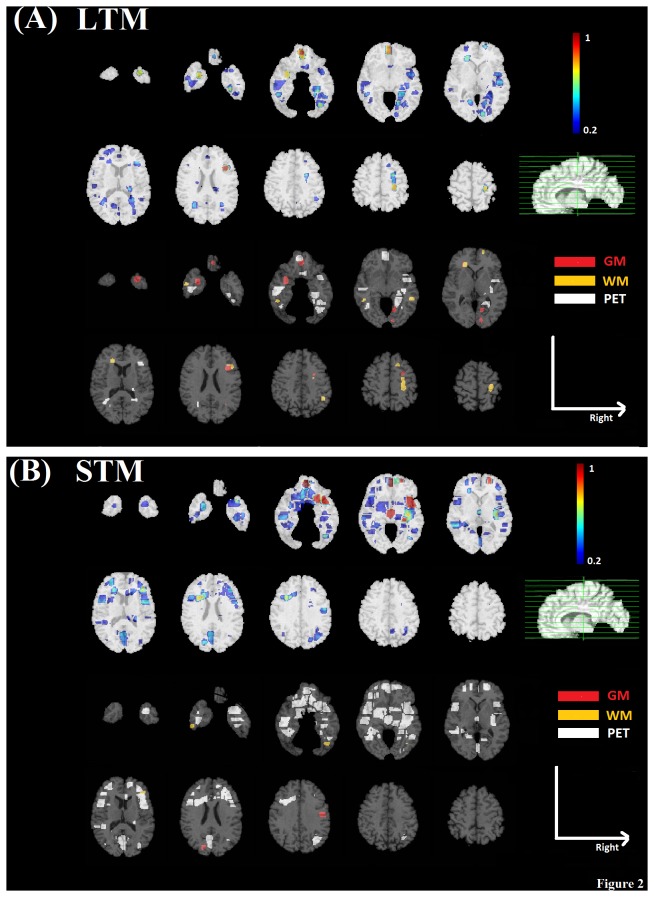
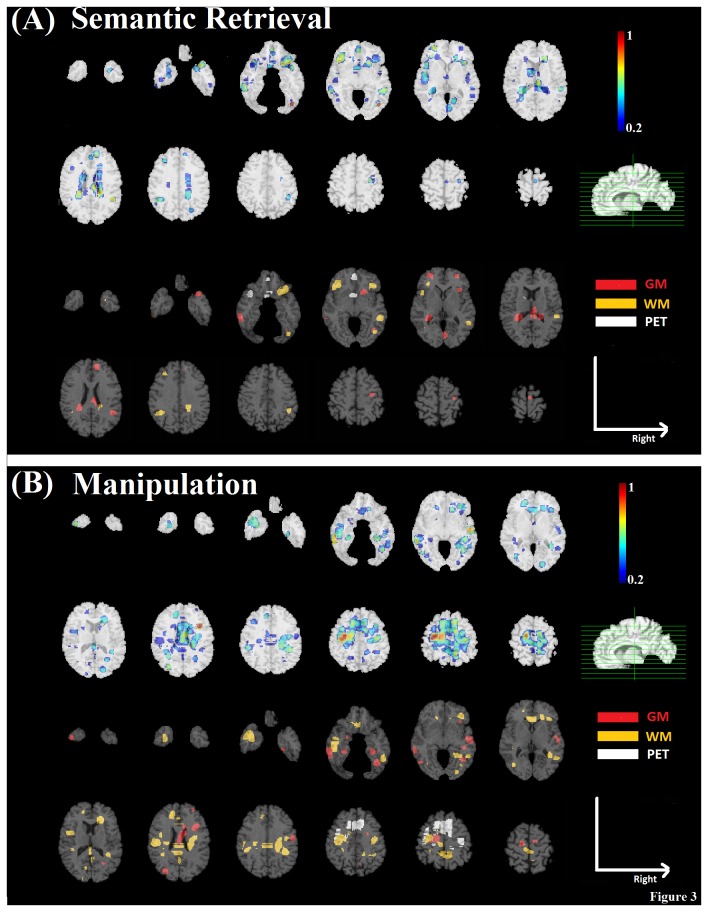
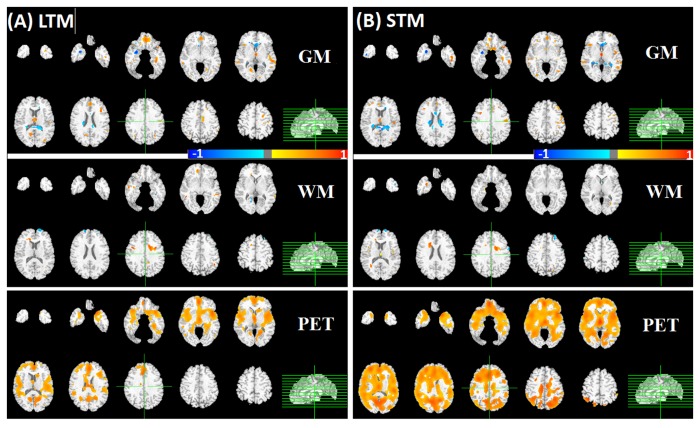
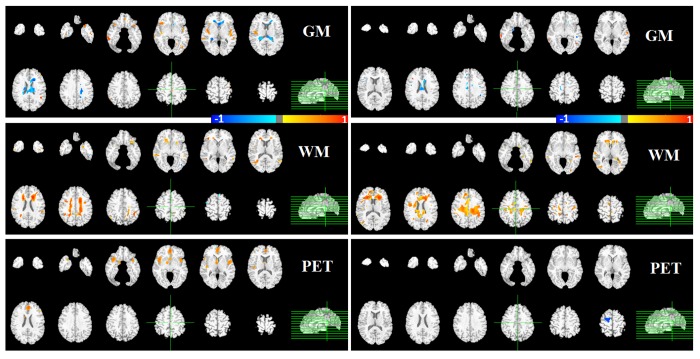
In this study, we used high-dimensional pattern regression methods based on structural (gray and white matter; GM and WM) and functional (positron emission tomography of regional cerebral blood flow; PET) brain data to identify cross-sectional imaging biomarkers of cognitive performance in cognitively normal older adults from the Baltimore Longitudinal Study of Aging (BLSA). We focused on specific components of executive and memory domains known to decline with aging, including manipulation, semantic retrieval, long-term memory (LTM), and short-term memory (STM). For each imaging modality, brain regions associated with each cognitive domain were generated by adaptive regional clustering. A relevance vector machine was adopted to model the nonlinear continuous relationship between brain regions and cognitive performance, with cross-validation to select the most informative brain regions (using recursive feature elimination) as imaging biomarkers and optimize model parameters. Predicted cognitive scores using our regression algorithm based on the resulting brain regions correlated well with actual performance. Also, regression models obtained using combined GM, WM, and PET imaging modalities outperformed models based on single modalities. Imaging biomarkers related to memory performance included the orbito-frontal and medial temporal cortical regions with LTM showing stronger correlation with the temporal lobe than STM. Brain regions predicting executive performance included orbito-frontal, and occipito-temporal areas. The PET modality had higher contribution to most cognitive domains except manipulation, which had higher WM contribution from the superior longitudinal fasciculus and the genu of the corpus callosum. These findings based on machine-learning methods demonstrate the importance of combining structural and functional imaging data in understanding complex cognitive mechanisms and also their potential usage as biomarkers that predict cognitive status.
Conflict of interest statement
Figures
Similar articles
-
Cognition in healthy aging is related to regional white matter integrity, but not cortical thickness.Neurobiol Aging. 2010 Nov;31(11):1912-26. doi: 10.1016/j.neurobiolaging.2008.10.015. Epub 2008 Dec 16. Neurobiol Aging. 2010. PMID: 19091444 Free PMC article.
-
Spatial Patterns of Longitudinal Gray Matter Change as Predictors of Concurrent Cognitive Decline in Amyloid Positive Healthy Subjects.J Alzheimers Dis. 2017;55(1):343-358. doi: 10.3233/JAD-160327. J Alzheimers Dis. 2017. PMID: 27662291
-
The significance of caudate volume for age-related associative memory decline.Brain Res. 2015 Oct 5;1622:137-48. doi: 10.1016/j.brainres.2015.06.026. Epub 2015 Jun 25. Brain Res. 2015. PMID: 26119913
-
Structural imaging measures of brain aging.Neuropsychol Rev. 2014 Sep;24(3):271-89. doi: 10.1007/s11065-014-9268-3. Epub 2014 Aug 22. Neuropsychol Rev. 2014. PMID: 25146995 Free PMC article. Review.
-
Neurobiological findings associated with high cognitive performance in older adults: a systematic review.Int Psychogeriatr. 2018 Dec;30(12):1813-1825. doi: 10.1017/S1041610218000431. Epub 2018 Apr 18. Int Psychogeriatr. 2018. PMID: 29667572
Cited by
-
A robust brain signature region approach for episodic memory performance in older adults.Brain. 2021 May 7;144(4):1089-1102. doi: 10.1093/brain/awab007. Brain. 2021. PMID: 33895818 Free PMC article.
-
Quantifying performance of machine learning methods for neuroimaging data.Neuroimage. 2019 Oct 1;199:351-365. doi: 10.1016/j.neuroimage.2019.05.082. Epub 2019 Jun 5. Neuroimage. 2019. PMID: 31173905 Free PMC article.
-
Linking interindividual variability in brain structure to behaviour.Nat Rev Neurosci. 2022 May;23(5):307-318. doi: 10.1038/s41583-022-00584-7. Epub 2022 Apr 1. Nat Rev Neurosci. 2022. PMID: 35365814 Review.
-
An efficient algorithm for estimating brain covariance networks.PLoS One. 2018 Jul 12;13(7):e0198583. doi: 10.1371/journal.pone.0198583. eCollection 2018. PLoS One. 2018. PMID: 30001336 Free PMC article.
-
Multimodal tract-based MRI metrics outperform whole brain markers in determining cognitive impact of small vessel disease-related brain injury.Brain Struct Funct. 2022 Sep;227(7):2553-2567. doi: 10.1007/s00429-022-02546-2. Epub 2022 Aug 22. Brain Struct Funct. 2022. PMID: 35994115 Free PMC article.
References
-
- Albert MS, DeKosky ST, Dickson D, Dubois B, Feldman HH et al. (2011) The diagnosis of mild cognitive impairment due to Alzheimers disease: Recommendations from the National Institute on Aging and Alzheimers Association workgroup. Alzheimer'S Dementia 7: 270–279. doi:10.1016/j.jalz.2011.03.008. PubMed: 21514249. - DOI - PMC - PubMed
-
- De Rover M, Pironti VA, McCabe JA, Acosta-Cabronero J, Arana FS et al. (2011) Hippocampal dysfunction in patients with mild cognitive impairment: a functional neuroimaging study of a visuo-spatial paired associates learning task. Neuropsychologia 49: 2060–2070. doi:10.1016/j.neuropsychologia.2011.03.037. PubMed: 21477602. - DOI - PubMed
Publication types
MeSH terms
Substances
Grants and funding
LinkOut - more resources
Full Text Sources
Other Literature Sources
Medical
