. 2013 Dec 31;8(12):e85658.
doi: 10.1371/journal.pone.0085658. eCollection 2013.

Assessment of clinical signs of liver cirrhosis using T1 mapping on Gd-EOB-DTPA-enhanced 3T MRI

Affiliations

Assessment of clinical signs of liver cirrhosis using T1 mapping on Gd-EOB-DTPA-enhanced 3T MRI

Michael Haimerl et al. PLoS One. .

Abstract

Objectives: To assess the differences between normal and cirrhotic livers by means of T1 mapping of liver parenchyma on gadoxetic acid (Gd-EOB-DTPA)-enhanced 3 Tesla (3T) MR imaging (MRI).

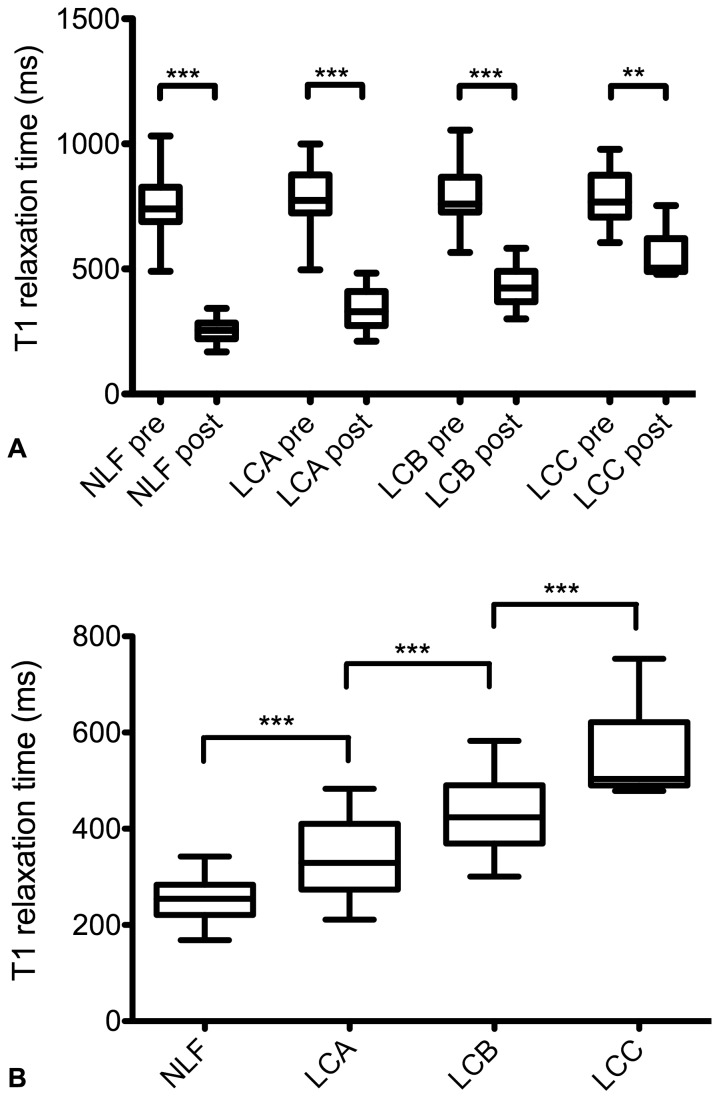
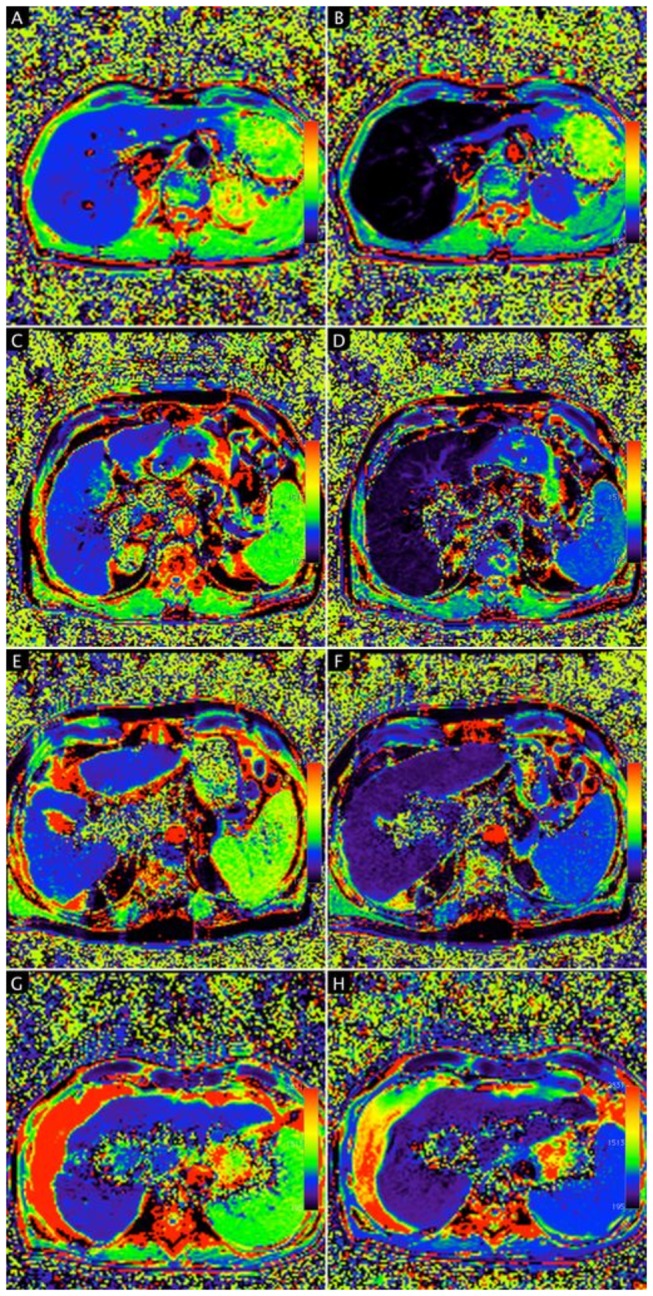
Methods: 162 patients with normal (n = 96) and cirrhotic livers (n = 66; Child-Pugh class A, n = 30; B, n = 28; C, n = 8) underwent Gd-EOB-DTPA-enhanced 3T MRI. To obtain T1 maps, two TurboFLASH sequences (TI = 400 ms and 1000 ms) before and 20 min after Gd-EOB-DTPA administration were acquired. T1 relaxation times of the liver and the reduction rate between pre- and post-contrast enhancement images were measured.

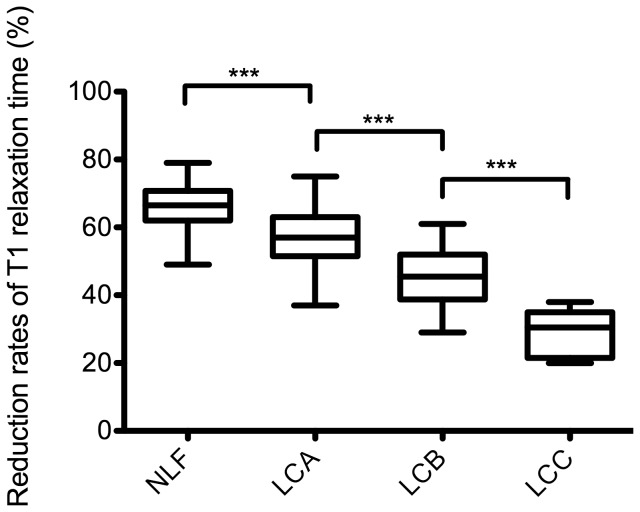
Results: The T1 relaxation times for Gd-EOB-DTPA-enhanced MRI showed significant differences between patients with normal liver function and patients with Child-Pugh class A, B, and C (p < 0.001). The T1 relaxation times showed a constant significant increase from Child-Pugh class A up to class C (Child-Pugh class A, 335 ms ± 80 ms; B, 431 ms ± 75 ms; C, 557 ms ± 99 ms; Child-Pugh A to B, p < 0.001; Child-Pugh A to C, p < 0.001; Child-Pugh B to C, p < 0.001) and a constant decrease of the reduction rate of T1 relaxation times (Child-Pugh class A, 57.1% ± 8.8%; B, 44.3% ± 10.2%, C, 29.9% ± 6.9%; Child-Pugh A to B, p < 0.001; Child-Pugh A to C,p < 0.001; Child-Pugh B to C, p < 0.001).

Conclusion: Gd-EOB-DTPA-enhanced T1 mapping of the liver parenchyma may present a useful method for determining severity of liver cirrhosis.


Conflict of interest statement

Competing Interests: The authors have declared that no competing interests exist.

Figures

Figure 1
Figure 1. Pre- and post-contrast T1 relaxation times.
(A) Boxplots indicating T1 relaxation times before (pre) and after (post) Gd-EOB-DTPA administration in patients with normal liver function and in patients with liver cirrhosis Child-Pugh A, Child-Pugh B, and Child-Pugh C. After contrast medium administration, T1 relaxation times were significantly reduced in each group. (B) Boxplots indicating T1 relaxation times after Gd-EOB-DTPA administration in patients with normal liver function and in patients with liver cirrhosis Child-Pugh A, Child-Pugh B, and Child-Pugh C. T1 relaxation times increased significantly with increased progression of liver cirrhosis. NLF: normal liver function; LCA: liver cirrhosis Child-Pugh A; LCB: liver cirrhosis Child-Pugh B; LCC: liver cirrhosis Child-Pugh C. Data given as mean T1 reduction rate ± standard deviation. Tukey’s adjustment was used to generate Boxplots, and the Wilcoxon-Test was used to compare groups. ***p ≤ 0.001, ** ≤ 0.01.
Figure 2
Figure 2. Reduction rates of T1 relaxation times.
Boxplots of reduction rates of T1 relaxation times of the liver in patients with normal liver function and in patients with liver cirrhosis classified as Child-Pugh A, Child-Pugh B, and Child-Pugh C. Reduction rates were significantly reduced with increasing progression of liver cirrhosis. NLF: normal liver function; LCA: liver cirrhosis Child-Pugh A; LCB: liver cirrhosis Child-Pugh B; LCC: liver cirrhosis Child-Pugh C. Data given as mean T1 reduction rate ± standard deviation. Tukey’s adjustment was used to generate Boxplots, and the Wilcoxon-Test was used to compare groups. ***p ≤ 0.001.
Figure 3
Figure 3. T1 relaxation times of the liver on T1 mapping color-coded images.
A - H, T1 mapping images calculated from 2 TurboFlash sequences (TI = 400 ms and 1000 ms) were obtained before (A, C, E, G) and 20 min after Gd-EOB-DTPA administration (B, D, F, H) in a patient with normal liver function (A, B) and patients with liver cirrhosis Child-Pugh A (C, D), Child-Pugh B (E, F), and Child-Pugh C (G, H). The mean T1 relaxation times of liver parenchyma were as follows: 755.6 ms (A), 211.9 ms (B), 717.1 ms (C), 316.0 ms (D), 760.5 ms (E), 434.0 ms (F), 705.7 ms (G) and 482.4 ms (H). The reduction rate of T1 relaxation times in patients with normal liver function and patients with liver cirrhosis Child-Pugh A, Child-Pugh B, and Child-Pugh C were 72%, 56%, 43%, and 32%, respectively. In patients with normal liver function, T1 relaxation times on T1 mapping color-coded images of the liver on post-contrast MRI (B) showed a markedly darker color distribution of the liver parenchyma than that on the pre-contrast mapping image (A), indicating a strong Gd-EOB-DTPA-induced shortening of T1 relaxation time 20 min after contrast medium administration. With increased progression of liver cirrhosis, the color distribution in the liver parenchyma could be visually confirmed to show less change on post-contrast T1- mapping images.

References

    1. Schuppan D, Afdhal NH (2008) Liver cirrhosis. Lancet 371: 838-851. doi:10.1016/S0140-6736(08)60383-9. PubMed: 18328931. - DOI - PMC - PubMed
    1. Schuppan D, Kim YO (2013) Evolving therapies for liver fibrosis. J Clin Invest 123: 1887-1901. doi:10.1172/JCI66028. PubMed: 23635787. - DOI - PMC - PubMed
    1. Kumada H, Okanoue T, Onji M, Moriwaki H, Izumi N et al. (2010) Guidelines for the treatment of chronic hepatitis and cirrhosis due to hepatitis B virus infection for the fiscal year 2008 in Japan. Hepatol Res 40: 1-7. doi:10.1111/j.1872-034X.2009.00633.x. PubMed: 20156295. - DOI - PubMed
    1. Kim AI, Saab S (2005) Treatment of hepatitis C. Am J Med 118: 808-815. doi:10.1016/j.amjmed.2005.01.073. PubMed: 16084169. - DOI - PubMed
    1. Regev A, Berho M, Jeffers LJ, Milikowski C, Molina EG et al. (2002) Sampling error and intraobserver variation in liver biopsy in patients with chronic HCV infection. Am J Gastroenterol 97: 2614-2618. doi:10.1111/j.1572-0241.2002.06038.x. PubMed: 12385448. - DOI - PubMed

Substances