. 2013 Oct 31:4:31.
doi: 10.4103/2153-3539.120874. eCollection 2013.

3D prostate histology image reconstruction: Quantifying the impact of tissue deformation and histology section location

Affiliations

3D prostate histology image reconstruction: Quantifying the impact of tissue deformation and histology section location

Eli Gibson et al. J Pathol Inform. .

Abstract

Background: Guidelines for localizing prostate cancer on imaging are ideally informed by registered post-prostatectomy histology. 3D histology reconstruction methods can support this by reintroducing 3D spatial information lost during histology processing. The need to register small, high-grade foci drives a need for high accuracy. Accurate 3D reconstruction method design is impacted by the answers to the following central questions of this work. (1) How does prostate tissue deform during histology processing? (2) What spatial misalignment of the tissue sections is induced by microtome cutting? (3) How does the choice of reconstruction model affect histology reconstruction accuracy?

Materials and methods: Histology, paraffin block face and magnetic resonance images were acquired for 18 whole mid-gland tissue slices from six prostates. 7-15 homologous landmarks were identified on each image. Tissue deformation due to histology processing was characterized using the target registration error (TRE) after landmark-based registration under four deformation models (rigid, similarity, affine and thin-plate-spline [TPS]). The misalignment of histology sections from the front faces of tissue slices was quantified using manually identified landmarks. The impact of reconstruction models on the TRE after landmark-based reconstruction was measured under eight reconstruction models comprising one of four deformation models with and without constraining histology images to the tissue slice front faces.

Results: Isotropic scaling improved the mean TRE by 0.8-1.0 mm (all results reported as 95% confidence intervals), while skew or TPS deformation improved the mean TRE by <0.1 mm. The mean misalignment was 1.1-1.9(°) (angle) and 0.9-1.3 mm (depth). Using isotropic scaling, the front face constraint raised the mean TRE by 0.6-0.8 mm.

Conclusions: For sub-millimeter accuracy, 3D reconstruction models should not constrain histology images to the tissue slice front faces and should be flexible enough to model isotropic scaling.

Keywords: 3D histology reconstruction; Correlative histopathology; image registration; prostate cancer imaging; validation.


Figures

Figure 1
Figure 1
Overview of the specimen processing, imaging and analysis
Figure 2
Figure 2
Schematic representations of tissue, landmarks and measurements, including (a) a surface rendering of a tissue slice magnetic resonance image, (b) a schematic rendering of the tissue slice with the front face fiducials fi,j and the best fit front face plane Fj, (c) a projected side view of the tissue slice as oriented over the microtome blade with the front face fiducials fi,j, the best fit front face plane Fj, the histology-visible landmarks mi, j, the best fit histology section plane Hj, the orientation θj and the depth measurement dj, (d) a schematic rendering of the tissue slice with the histology-visible landmarks and the best fit histology section plane Hj, (e) a schematic rendering of the paraffin block face after histological sectioning showing the homologous landmarks pi, j and (f) a schematic rendering of the corresponding histology section with the homologous landmarks hi,j
Figure 3
Figure 3
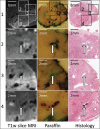
Illustrative examples of the T1-weighted tissue slice magnetic resonance (left), paraffin (middle) and histology (right) images transformed by a best-fit affine transformation aligning manually identified landmarks. The three highlighted regions in row 1 are shown magnified in rows 2, 3 and 4, with the corresponding landmarks denoted by arrows
Figure 4
Figure 4
Boxplot showing the target registration errors of homologous landmarks under four deformation models for the tissue deformation due to histological processing and cutting. These results correspond to the descriptive statistics shown in the first row of Table 1
Figure 5
Figure 5
Histograms of histology section depths and orientations. The subset of tissue slices illustrated in Figure 7 is shown in dark gray
Figure 6
Figure 6
Correlation of minimum, mean and maximum histology section depths with orientations. Tissue slices corresponding to sections marked with circles are shown in Figure 7
Figure 7
Figure 7
Renderings of the spatial relationships between tissue slices, histology-visible landmarks, front face plane and histology section planes for 10 tissue slices, ordered by increasing mean depth from left to right. Each tissue slice is shown as a silhouette projected along n(Fj) × n(Hj), the cross-product of the front face and histology section plane normals. With this projection, the front face plane Fj and the histology section plane Hj can be represented as solid and dashed lines respectively. The projected histology-visible landmarks mi, j are shown as circles
Figure 8
Figure 8
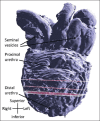
3D reconstruction of three histology sections aligned (with a mean TRE of 0.5 mm) to an anterior view of 3D surface rendering of the corresponding intact ex vivo prostate gland with seminal vesicles, illustrating the potential for non-parallel, non-evenly spaced histological tissue sections
Figure 9
Figure 9
Sample sizes, relative to an arbitrarily chosen baseline, for imaging validation studies of the image signal differences between cancerous and background tissue for 0.2 cm3 cancer foci, under assumptions that foci are spherical and reconstruction error can be modeled as a translation error distributed as a 3D Gaussian and is combined in quadrature with a 2.1 mm TRE due to registration to in vivo imaging. Reconstructions under differing deformation assumptions and with or without the front face assumption are indicated, with the reconstruction using a similarity transform and the front face assumption arbitrarily chosen as the 100% baseline reference

References

    1. Turkbey B, Albert PS, Kurdziel K, Choyke PL. Imaging localized prostate cancer: Current approaches and new developments. AJR Am J Roentgenol. 2009;192:1471–80. - PMC - PubMed
    1. Sciarra A, Barentsz J, Bjartell A, Eastham J, Hricak H, Panebianco V, et al. Advances in magnetic resonance imaging: How they are changing the management of prostate cancer. Eur Urol. 2011;59:962–77. - PubMed
    1. Vargas HA, Akin O, Franiel T, Mazaheri Y, Zheng J, Moskowitz C, et al. Diffusion-weighted endorectal MR imaging at 3 T for prostate cancer: Tumor detection and assessment of aggressiveness. Radiology. 2011;259:775–84. - PMC - PubMed
    1. Engelbrecht MR, Barentsz JO, Jager GJ, van der Graaf M, Heerschap A, Sedelaar JP, et al. Prostate cancer staging using imaging. BJU Int. 2000;86(Suppl 1):123–34. - PubMed
    1. Ellis RJ, Kaminsky DA. Fused radioimmunoscintigraphy for treatment planning. Rev Urol. 2006;8(Suppl 1):S11–9. - PMC - PubMed