. 2014 Jan 7;15(1):R8.
doi: 10.1186/gb-2014-15-1-r8.

PAR-CLIP data indicate that Nrd1-Nab3-dependent transcription termination regulates expression of hundreds of protein coding genes in yeast

PAR-CLIP data indicate that Nrd1-Nab3-dependent transcription termination regulates expression of hundreds of protein coding genes in yeast

Shaun Webb et al. Genome Biol. .

Abstract

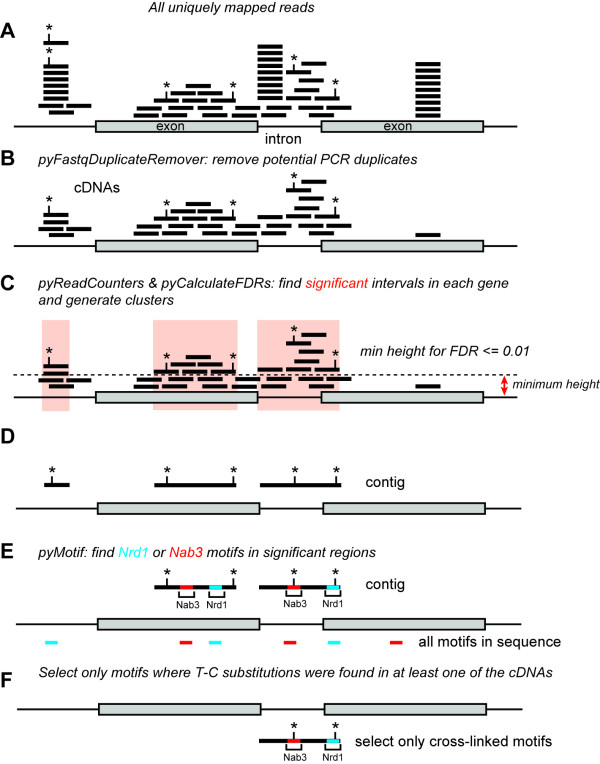
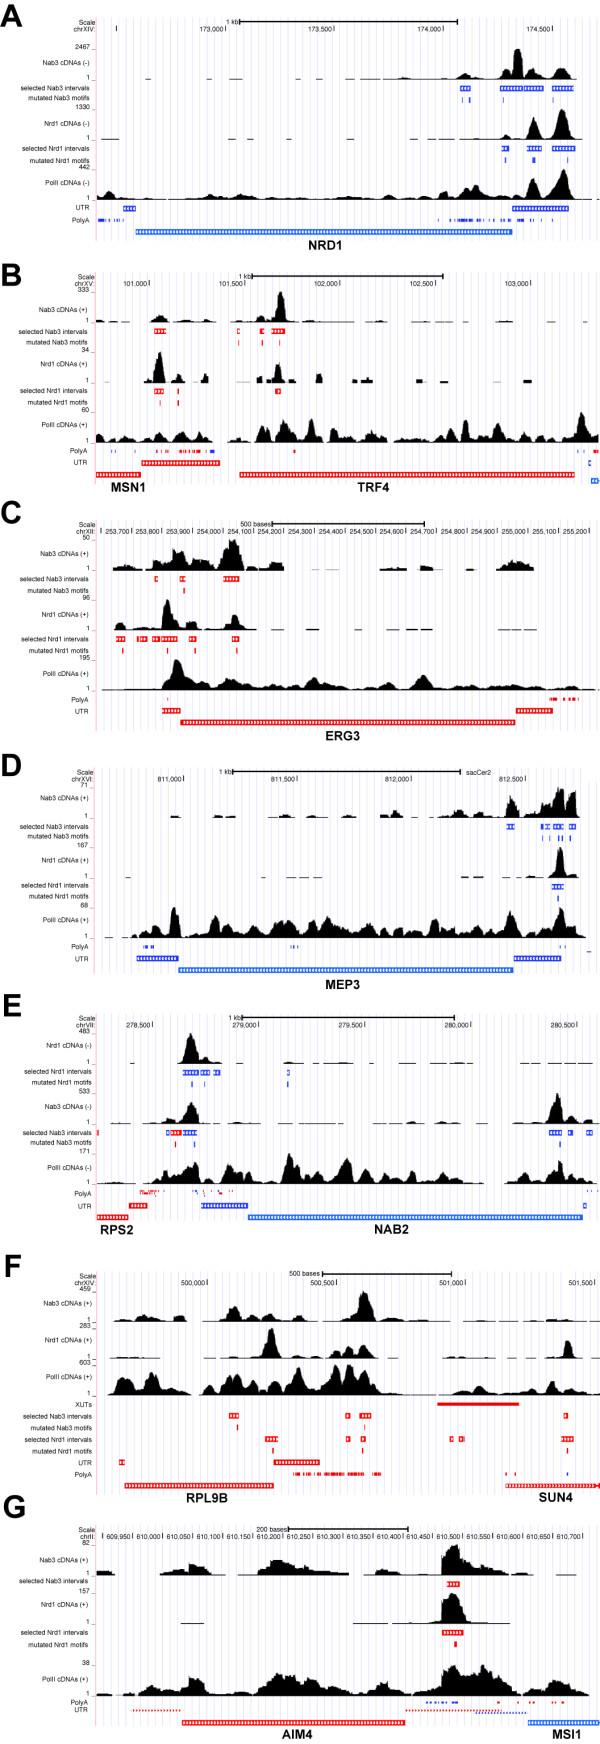
Background: Nrd1 and Nab3 are essential sequence-specific yeast RNA binding proteins that function as a heterodimer in the processing and degradation of diverse classes of RNAs. These proteins also regulate several mRNA coding genes; however, it remains unclear exactly what percentage of the mRNA component of the transcriptome these proteins control. To address this question, we used the pyCRAC software package developed in our laboratory to analyze CRAC and PAR-CLIP data for Nrd1-Nab3-RNA interactions.

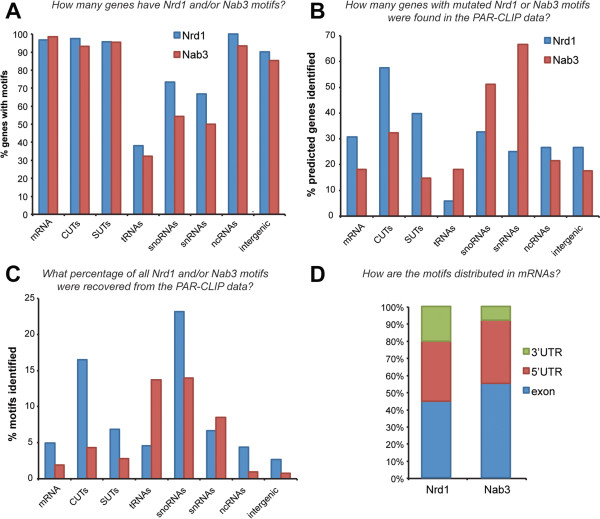
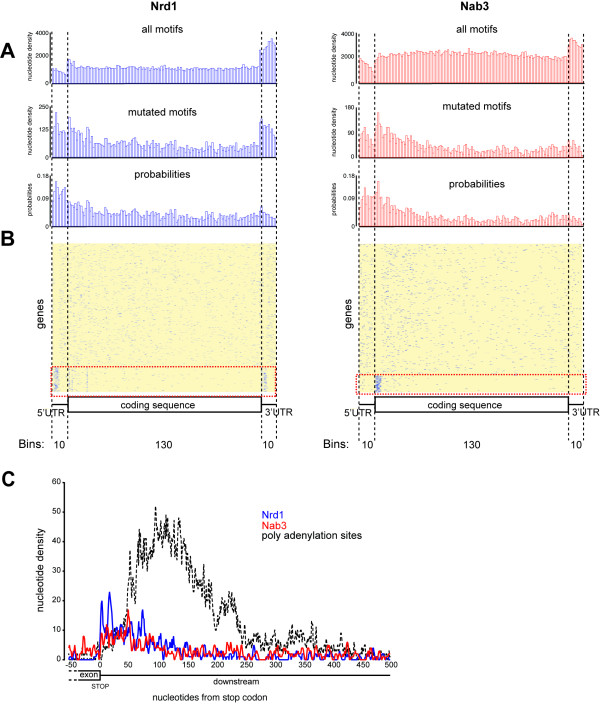
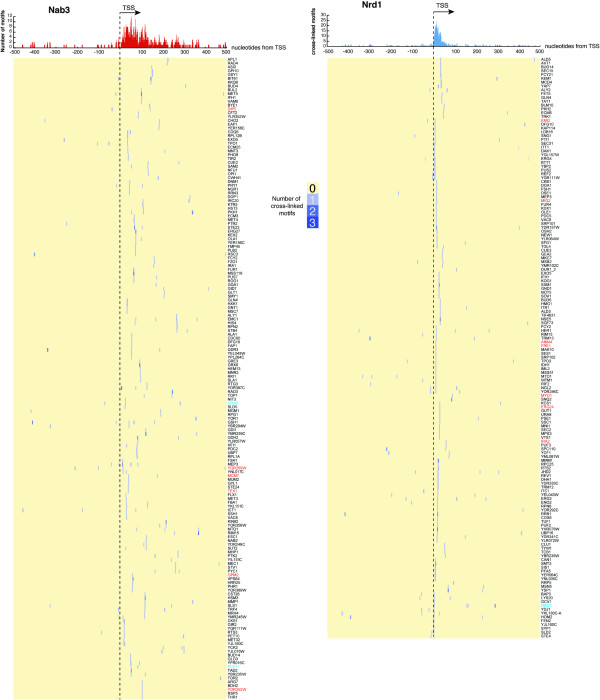
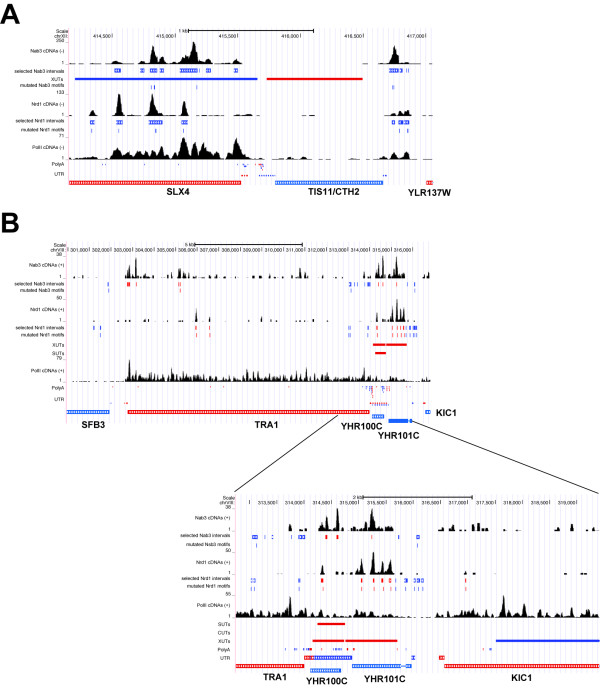
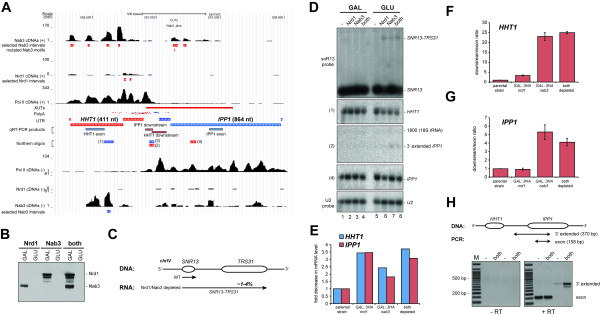
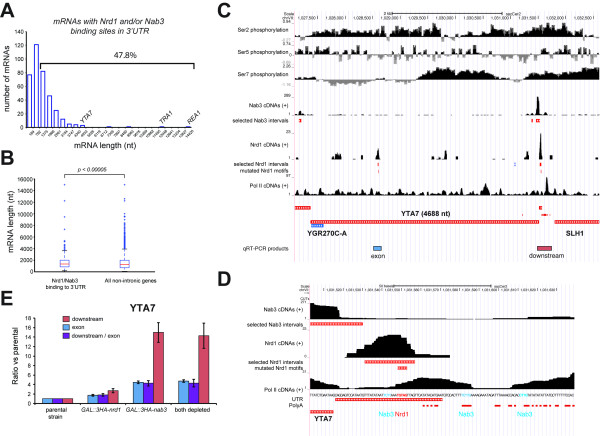
Results: We generated high-resolution maps of Nrd1-Nab3-RNA interactions, from which we have uncovered hundreds of new Nrd1-Nab3 mRNA targets, representing between 20 and 30% of protein-coding transcripts. Although Nrd1 and Nab3 showed a preference for binding near 5' ends of relatively short transcripts, they bound transcripts throughout coding sequences and 3' UTRs. Moreover, our data for Nrd1-Nab3 binding to 3' UTRs was consistent with a role for these proteins in the termination of transcription. Our data also support a tight integration of Nrd1-Nab3 with the nutrient response pathway. Finally, we provide experimental evidence for some of our predictions, using northern blot and RT-PCR assays.

Conclusions: Collectively, our data support the notion that Nrd1 and Nab3 function is tightly integrated with the nutrient response and indicate a role for these proteins in the regulation of many mRNA coding genes. Further, we provide evidence to support the hypothesis that Nrd1-Nab3 represents a failsafe termination mechanism in instances of readthrough transcription.


Figures

Figure 1
Figure 1
Schematic overview of the read-processing steps used for our analyses. Shown is a schematic representation of a gene containing two exons and one intron. Each black line indicates a read and asterisks indicate positions of T-C substitutions. (A, B) The first step involved removal of all identical sequences in raw reads by collapsing the data (using pyFastqDuplicateRemover) and aligning the remaining cDNA sequences to the genome. (C) pyCalculateFDRs was used to calculate the minimum read coverage height required to obtain an FDR ≤0.01. (D) Contigs were generated from significantly enriched regions and T-C mutation frequencies were calculated (using pyCalculateMutationFrequencies). (E, F) We then used pyMotif to identify Nrd1-Nab3 motifs in contigs (E), and selected only those motifs where we could find at least one T-C mutation in overlapping reads (F). These are referred to as ‘cross-linked motifs’ throughout the manuscript.
Figure 2
Figure 2
Comparison of predicted and identified binding sites. (A) Overview of the percentage (y-axis) of genes in genomic features (x-axis) that contain Nrd1 (blue) or Nab3 (red) motifs in their sequence. (B) The percentage of genomic features that contained cross-linked Nrd1 or Nab3 motifs. (C) The percentage of all Nrd1 and Nab3 motifs in gene/feature sequences found in the PAR-CLIP data analyses. (D) The distribution of cross-linked motifs over UTR and exon sequences. ncRNA, non-coding RNA; snRNA, small nuclear RNA.
Figure 3
Figure 3
Distribution of Nrd1 and Nab3 motifs in protein coding regions. (A) Nrd1 and Nab3 preferentially bind near 5′ ends of mRNA transcripts. Shown are pyBinCollector coverage plots displaying the Nrd1 and Nab3 motif distribution in the exons and UTRs of all non-intronic mRNAs. To normalize the gene lengths the exon sequences were divided in 130 bins and UTRs in 10 bins. Probabilities were calculated by dividing the density values for cross-linked motifs found in the PAR-CLIP data by the density values for all the motifs found in mRNA coding genes. (B) Heat map showing the distribution of cross-linked Nrd1 and Nab3 motifs (blue) over individual protein coding genes. pyBinCollector was used to produce a distribution matrix of cross-linked motifs over individual protein coding sequences and the resulting output was k-means clustered using Cluster 3.0. (C) Distribution of cross-linked Nrd1 and Nab3 motifs around stop codons and relative to the positions of polyadenylation sites.
Figure 4
Figure 4
Distribution of cross-linked Nrd1 and Nab3 motifs around transcription start sites. The pileup on top of the heat maps indicates the cumulative distribution of cross-linked motifs within a 500-nucleotide window of transcription start sites. The heat map shows the distribution of cross-linked motifs (blue) within individual transcripts. The dashed line indicates the positions of transcription start sites. Red gene names indicate genes where cryptic transcription was detected upstream, whereas cyan colored gene names indicate transcripts previously shown to be regulated by Nrd1-Nab3-dependent transcription termination.
Figure 5
Figure 5
Nrd1 and Nab3 binding to a selected number of protein-coding transcripts. (A-G) Shown are UCSC genome browser images for a number of genes predicted to be regulated by Nrd1-Nab3. Coverage of unique cDNAs from Nrd1, Nab3 and Pol II (Rpb2) PAR-CLIP data [6,29] on Watson (+) and Crick (-) strands is shown as black histograms. Locations of cross-linked Nrd1-Nab3 motifs (this work), annotated Xrn1-sensitive unstable transcripts (XUTs), polyadenylation sites and UTRs [22,38-41] are included as rectangles. Genomic features located on the Watson (+) strand are indicated in red, whereas features on the Crick (-) strand are indicated in blue. ‘Selected intervals’ indicate genomic regions with a read coverage FDR ≤0.01. These were used for pyMotif analyses.
Figure 6
Figure 6
Nrd1 and Nab3 binding to CHT2, SLX4 and TRA1 transcripts. (A, B) Coverage of unique cDNAs from Nrd1, Nab3 and Pol II (Rpb2) PAR-CLIP data [6,29] on Watson (+) and Crick (-) strands is shown as black histograms. ‘Selected intervals’ indicates genomic regions with a read coverage FDR ≤0.01 used for pyMotif analyses. Locations of cross-linked Nrd1-Nab3 motifs (this work), annotated XUTs, CUTs, SUTs (if present), polyadenylation sites and UTRs [22,38-41] are included as rectangles. Genomic features located on the Watson (+) strand are indicated in red, whereas features on the Crick strand (-) are indicated in blue.
Figure 7
Figure 7
Nab3 is required to suppress cryptic transcriptional activities. (A) UCSC genome browser images of the region showing HHT1 and IPP1. ‘Selected intervals’ indicate genomic regions with a read coverage FDR =0.01 used for pyMotif analyses. See the legend to Figure 5 for additional details. Chromosomal positions of RT-PCR products and northern blot probes are also indicated. (B) Western blot displaying levels of 3HA-tagged Nrd1 and Nab3 proteins before and after the shift to glucose. Experimental details are provided in the Materials and methods. Proteins were detected using horse radish-conjugated anti-HA antibodies (Santa Cruz). (C) Schematic representation of transcripts generated in the SNR13-TRS31 region of yeast chromosome IV (adapted from [13]). About 1 to 4% of the SNR13 transcripts were read-through transcripts in Nab3 and Nrd1 depleted cells, respectively. (D) Northern blot analysis of IPP1, HHT1, snR13 and U2 snRNA and 3' extended species. Shown are phosphoimager scans of a blot probed with various oligonucleotides (indicated on the left of each panel). U2 snRNA levels were used as a loading control. (E) Depletion of Nrd1 and/or Nab3 results in a reduction of HHT1 and IPP1 mRNA levels. The mRNA levels were quantified using the AIDA software package and normalized to both the levels in the parental strain and the U2 snRNA. (F, G). Quantitative RT-PCR analysis of HHT1 and IPP1 transcription in coding sequences (exon) and downstream regions. Fold change in transcription downstream of these genes was calculated by normalizing the data of the downstream regions to the signals obtained for the exon region. Error bars indicate standard deviations (H) Detection of IPP1 read-through transcripts by end-point RT-PCR. The diagram indicates the regions amplified. The position of 3' extended products and exon fragments in the gel are indicated on the right of the gel image.
Figure 8
Figure 8
Nrd1 and Nab3 can terminate transcription of long transcripts by binding to 3′ UTRs. (A, B) Nrd1 and Nab3 preferentially bind transcripts approximately ≤1 kb. The histogram in (A) shows the length distribution (including UTRs) of transcripts bound by Nrd1 and Nab3 in the 3′ UTR. Only transcripts where cross-linked motifs mapped to the 3′ UTR were selected. The bracket indicates the percentage of transcripts longer than 782 nucleotides. The boxplot in (B) shows a comparison of the length distribution of the transcripts in (A) with the length distribution of all non-intronic protein coding genes in yeast. The P-value was calculated using a two-sample Kolmogorov-Smirnov test and indicates the likelihood that the two samples originate from the same continuous distribution. (C, D) UCSC genome browser images of YTA7 region. ‘Selected intervals’ indicate genomic regions with a read coverage FDR ≤0.01 used for pyMotif analyses. The Pol II serine phosphorylation ChIP data were obtained from [37]. See the legend to Figure 5 for more details. Chromosomal positions of RT-PCR products are indicated below the YTA7 gene. The Nab3 and Nrd1 motifs in the approximately 100 bp region downstream of YTA7 are indicated in cyan and red, respectively. (E). Quantitative-RT-PCR results for YTA7 coding sequence (exon) and downstream region. Error bars indicate standard deviations.

Similar articles

Cited by

References

    1. Hafner M, Landthaler M, Burger L, Khorshid M, Hausser J, Berninger P, Rothballer A, Ascano M, Jungkamp A-C, Munschauer M, Ulrich A, Wardle GS, Dewell S, Zavolan M, Tuschl T. Transcriptome-wide identification of RNA-binding protein and microRNA target sites by PAR-CLIP. Cell. 2010;141:129–141. doi: 10.1016/j.cell.2010.03.009. - DOI - PMC - PubMed
    1. König J, Zarnack K, Rot G, Curk T, Kayikci M, Zupan B, Turner DJ, Luscombe NM, Ule J. iCLIP reveals the function of hnRNP particles in splicing at individual nucleotide resolution. Nat Struct Mol Biol. 2010;17:909–915. doi: 10.1038/nsmb.1838. - DOI - PMC - PubMed
    1. Licatalosi DD, Mele A, Fak JJ, Ule J, Kayikci M, Chi SW, Clark TA, Schweitzer AC, Blume JE, Wang X, Darnell JC, Darnell RB. HITS-CLIP yields genome-wide insights into brain alternative RNA processing. Nature. 2008;456:464–469. doi: 10.1038/nature07488. - DOI - PMC - PubMed
    1. Wang Z, Kayikci M, Briese M, Zarnack K. iCLIP predicts the dual splicing effects of TIA-RNA interactions. PLoS Biol. 2010;8:e1000530. doi: 10.1371/journal.pbio.1000530. - DOI - PMC - PubMed
    1. Granneman S, Kudla G, Petfalski E, Tollervey D. Identification of protein binding sites on U3 snoRNA and pre-rRNA by UV cross-linking and high-throughput analysis of cDNAs. Proc Natl Acad Sci U S A. 2009;106:9613–9618. doi: 10.1073/pnas.0901997106. - DOI - PMC - PubMed

Publication types

MeSH terms

LinkOut - more resources