Review
. 2014 Apr;281(8):1965-73.
doi: 10.1111/febs.12667. Epub 2014 Jan 2.

Examining weak protein-protein interactions in start codon recognition via NMR spectroscopy

Affiliations
Review

Examining weak protein-protein interactions in start codon recognition via NMR spectroscopy

Rafael E Luna et al. FEBS J. 2014 Apr.

Abstract

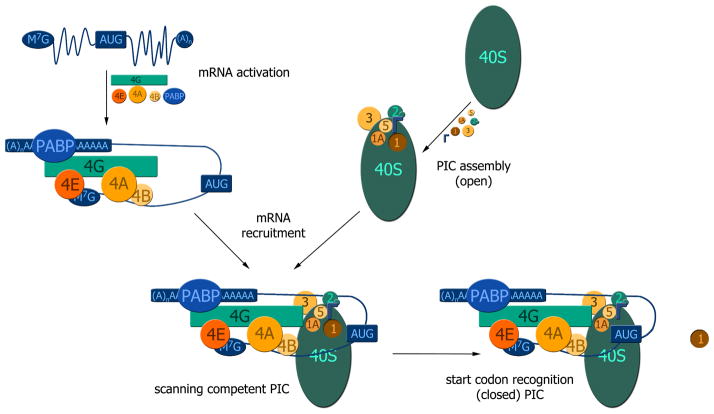
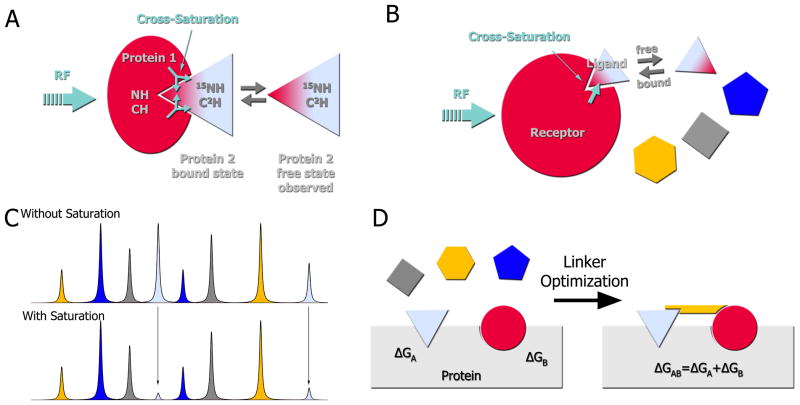
Weak protein-protein interactions are critical in numerous biological processes. Unfortunately, they are difficult to characterize due to the high concentrations required for the production and detection of the complex population. The inherent sensitivity of NMR spectroscopy to the chemical environment makes it an excellent tool to tackle this problem. NMR permits the exploration of interactions over a range of affinities, yielding essential insights into dynamic biological processes. The conversion of messanger RNA to protein is one such process that requires the coordinated association of many low-affinity proteins. During start codon recognition, eukaryotic initiation factors assemble into high-order complexes that bind messanger RNA and bring it to the ribosome for decoding. Many of the structures of the eukaryotic initiation factors have been determined; however, little is known regarding the weak binary complexes formed and their structure-function mechanisms. Herein, we use start codon recognition as a model system to review the relevant NMR methods for the characterization of weak interactions and the development of small molecule inhibitors.

Keywords: chemical shift perturbation; cross saturation; fragment based screening; initiation factors; nuclear magnetic resonance; paramagnetic relaxation enhancement; residual dipolar couplings; small angle X-Ray scattering reconstitution assay; translation initiation; weak interactions.


Figures

Figure 1
Figure 1. Overall schematic of the scanning process that translation preinitiation complexes undergo to reach the start codon
The messenger RNA is activated by eIF4E binding to the 5′ cap of messenger RNAs (blue) and operates within the larger complex of eIF4F (eIF4E/eIF4G/eIF4A) along with eIF4B and PABP (Top left). eIF1, eIF1A, eIF2-TC, eIF5 and eIF3 bind to the 40S ribosomal particle and prepare it for the recruitment of mRNA. eIF3 binds to the solvent side of the 40S particle, while eIF1A, eIF1, eIF2-TC and eIF5 bind to the subunit interface of the 40S particle, which is assembled into the translation preinitiation complex PIC (open) (Top right). These eIF-driven higher order complexes combine to form a scanning PIC, which inspects triplets in search of the proper start codon (Bottom left). Once the PIC recognizes the start codon, eIF1 is released and the PIC switches from the open to the closed state (Bottom right).
Figure 2
Figure 2. Chemical shift perturbations and SAXS as complementary tools for the study of protein-protein interfaces
A) Overlay of 1H-15N HSQC spectra of 15N-eIF5-CTD titrated with increasing concentrations of eIF2β–K2K3 from 0–1 molar equivalents (colored from gray to red). The inset shift perturbation exemplifies the expected pattern of chemical shift averaging for fast exchange. B) Plot of chemical shift changes at a 1:1 ratio of eIF5-CTD: eIF2β–K2K3 versus the residue number. Chemical shift perturbations were calculated using the following equation: CSP=((Δ1H)2+(Δ15N/5)2)0.5. Gray bars indicate residues with no assignment. C) Mapping of the perturbations onto the structure of eIF5-CTD (color corresponds to magnitude of shift perturbation). D) Principle of the SAXS reconstitution assay. A mixture of proteins is subjected to the X-ray beam and Rg vales are extracted from the scattering profile. If the two proteins in the mixture don’t interact with each other, the Rg represents a concentration-weighted average of the individual proteins’ Rg values. If the two proteins associate, the Rg is the weighted average of the complex’s Rg and the Rg of the protein in excess. Titration of one protein to another will produce a typical binding curve for the change in Rg values. E) Using the SAXS reconstitution assay, the titration of eIF2β–NTD (left) and eIF2β–K2K3 (right) to eIF5-CTD clearly show that a complex is formed in both cases. In the case of eIF2β–NTD, a second binding event is observed at increasing eIF2β–NTD concentrations.
Figure 3
Figure 3. Principles of residual dipolar couplings and paramagnetic relaxation enhancement
A) In an isotropic medium (left) proteins tumble freely averaging out any dipolar couplings. Addition of filamentous phage, nanotubes, bicelles, compressed gels etc. produces a modest anisotropy of the proteins (right). For illustration purposes all molecules here are aligned; however, in practice, the media are tuned to produce about 0.1% alignment. This partial alignment leads to an incomplete averaging of anisotropic magnetic interactions manifested in residual dipolar couplings. B) In isotropic conditions, the spectrum of a coupled resonance yields two peaks separated by the J-coupling. In anisotropic conditions, the peaks are separated by the sum of the J-coupling and the residual dipolar coupling. Therefore, RDCs can be easily extracted by comparing the effective couplings under isotropic and anisotropic conditions. C) For paramagnetic relaxation enhancement, a paramagnetic spin label, which is a stable free radical, is covalently linked to the thiol of a lone cysteine residue (left side). This spin-labeled protein is then added to 15N-labeled cognate partner, which subsequently broadens the interface resonances on its 1H-15N HSQC spectrum. Subsequently, the radical is quenched by reduction with ascorbic acid, and the spectrum is collected under the same conditions. Upon reduction, the previously broadened resonances reappear, which facilitates mapping of the interaction interface within ~20 Å of the spin-labeled probe.
Figure 4
Figure 4. Modeling weak protein complexes with PREs
A) Overlay of 1H-15N HSQC spectra of 0.2 mM 15N-labeled eIF5-CTD in the presence of 0.2 mM eIF1-K57C-MTSL (oxidized, red; reduced, black). B) This histogram corresponds with the 1H-15N HSQC spectra in A; oxidized and reduced, eIF1-K57C-MTSL. The ratio of oxidized/reduced cross-peak intensities is plotted as a function of eIF5-CTD residue number (adapted from [15]). Grey bars represent backbone resonances that are not assigned. C) eIF5-CTD residues most effected by eIF1-K57C-MTSL are mapped onto the protein surface. D) CSP and PRE experiments were used to restrain a model for the eIF1:eIF5-CTD complex using the software HADDOCK (Adapted from [15]).
Figure 5
Figure 5. Cross-saturation transfer experiments for protein-protein complexes and drug discovery
A) Principle of cross saturation transfer: The unlabeled receptor (protein 1) binds the 15N,2H-ligand (protein 2). The aliphatic frequencies of the receptor are then selectively irradiated, which then saturates the aliphatic, aromatic and amide resonances of the receptor through spin diffusion. This saturation is also transferred to ligand resonances located at the binding site and leads to a decrease in the respective HSQC peak intensities. If the complex has a high affinity, the HSQC spectrum would show the peaks of the bound form of the ligand. If the complex is weak, the HSQC would show the spectrum of the free ligand; nonetheless, the saturation has a longer lifetime than the exchange rate between free and bound form and the free form still “remembers” the saturation. B) Application of the cross saturation transfer principle to a mixture of fragments. The same principle as described in A) applies to any ligand binding to the receptor. C) In a mixture of compounds, only fragments that bind to the receptor (gray compound) would exhibit a change in peak intensities. D) Illustration of the SAR by NMR method [35]. First, a fragment library is screened against a protein of interest until two compounds, A and B, are identified that can simultaneously bind to proximal sites. These compounds are then linked together and again screened against the protein. Theoretically, these compounds can be linked into a single molecule whose binding affinity is the summation of the individual binding energies.

Similar articles

Cited by

References

    1. Aitken CE, Lorsch JR. A mechanistic overview of translation initiation in eukaryotes. Nature structural & molecular biology. 2012;19:568–576. doi: 10.1038/nsmb.2303. - DOI - PubMed
    1. Hinnebusch AG. Molecular mechanism of scanning and start codon selection in eukaryotes. Microbiology and molecular biology reviews: MMBR. 2011;75:434–467. doi: 10.1128/MMBR.00008-11. - DOI - PMC - PubMed
    1. Voigts-Hoffmann F, Klinge S, Ban N. Structural insights into eukaryotic ribosomes and the initiation of translation. Curr Opin Struct Biol. 2012 doi: 10.1016/j.sbi.2012.07.010. - DOI - PubMed
    1. Ben-Shem A, Garreau de Loubresse N, Melnikov S, Jenner L, Yusupova G, Yusupov M. The structure of the eukaryotic ribosome at 3.0 A resolution. Science. 2011;334:1524–1529. doi: 10.1126/science.1212642. - DOI - PubMed
    1. Ben-Shem A, Jenner L, Yusupova G, Yusupov M. Crystal structure of the eukaryotic ribosome. Science. 2010;330:1203–1209. - PubMed

Publication types

MeSH terms

LinkOut - more resources