. 2014 Jan 7;15(1):R5.
doi: 10.1186/gb-2014-15-1-r5.

Mammalian conserved ADAR targets comprise only a small fragment of the human editosome

Mammalian conserved ADAR targets comprise only a small fragment of the human editosome

Yishay Pinto et al. Genome Biol. .

Abstract

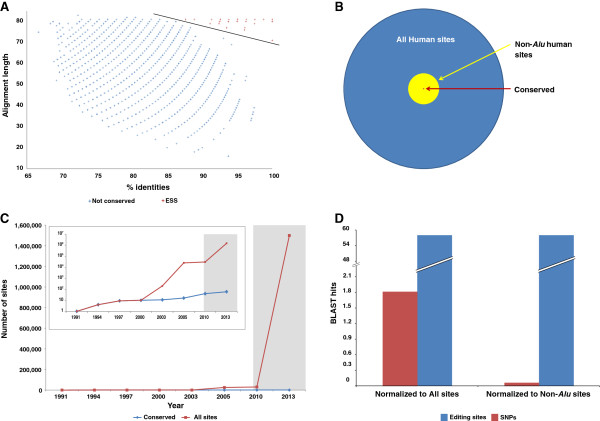
Background: ADAR proteins are among the most extensively studied RNA binding proteins. They bind to their target and deaminate specific adenosines to inosines. ADAR activity is essential, and the editing of a subset of their targets is critical for viability. Recently, a huge number of novel ADAR targets were detected by analyzing next generation sequencing data. Most of these novel editing sites are located in lineage-specific genomic repeats, probably a result of overactivity of editing enzymes, thus masking the functional sites. In this study we aim to identify the set of mammalian conserved ADAR targets.

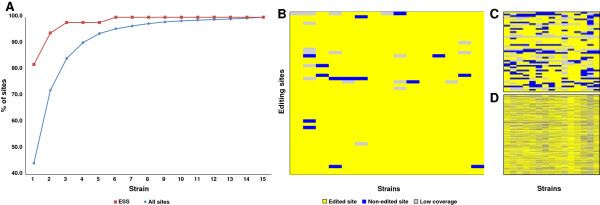
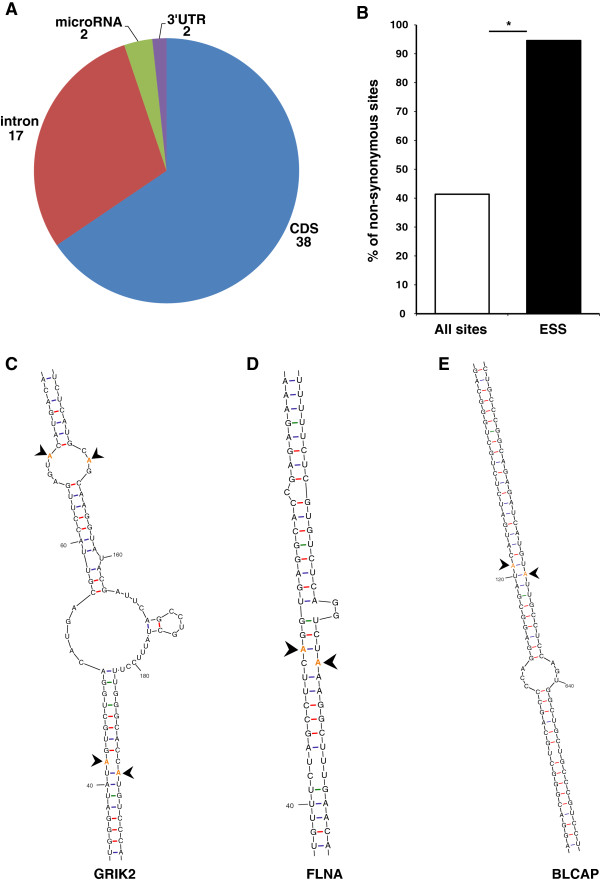
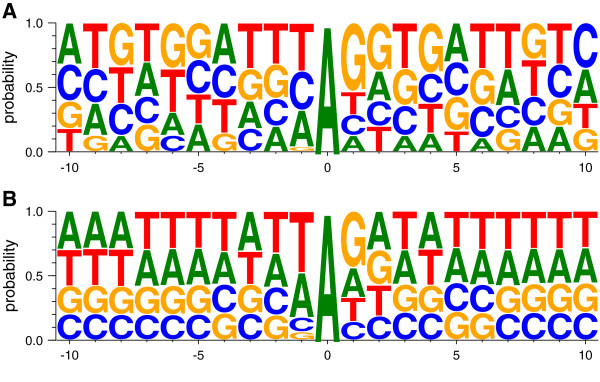
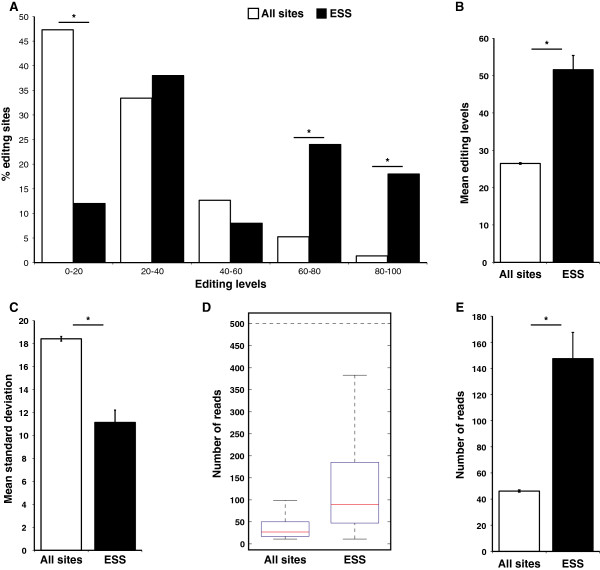
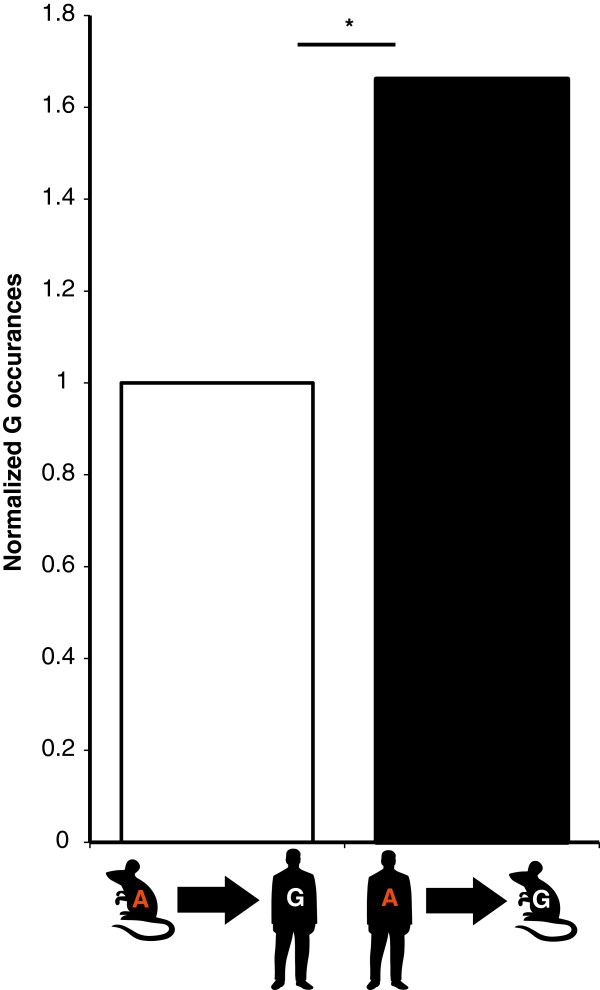
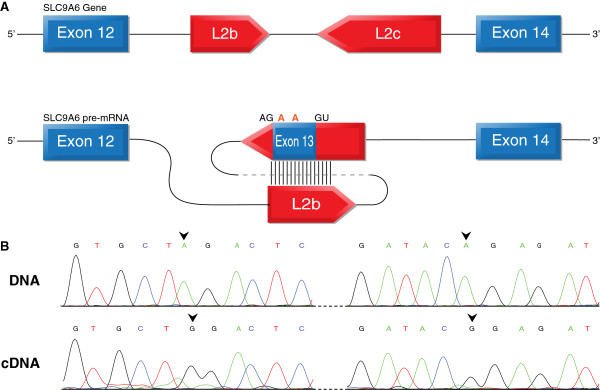
Results: We used RNA sequencing data from human, mouse, rat, cow, opossum, and platypus to define the conserved mammalian set of ADAR targets. We found that the conserved mammalian editing sites are surprisingly small in number and have unique characteristics that distinguish them from non-conserved ones. The sites that constitute the set have a distinct genomic distribution, tend to be located in genes encoding neurotransmitter receptors or other synapse related proteins, and have higher editing and expression levels. We also found a high consistency of editing levels of this set within mice strains and between human and mouse. Tight regulation of editing in these sites across strains and species implies their functional importance.

Conclusions: Despite the discovery of numerous editing targets, only a small number of them are conserved within mammalian evolution. These sites are extremely highly conserved and exhibit unique features, such as tight regulation, and probably play a pivotal role in mammalian biology.


Figures

Figure 1
Figure 1
Mammalian set of editing sites. (A) BLAST hits for human-mouse editing sets alignment, the Y axis represents the alignment length and the X axis represents the identity percent. The conserved set is colored red, non-conserved hits are colored blue, and the linear separator is colored in black. (B) Venn diagram of human editing sites shows that only a tiny fraction of the editing sites are conserved. The conserved sites are small minority of the non-Alu sites, as well. All sites (1,432,744) are colored blue, non-Alu sites (52,312) are colored yellow, and 59 conserved sites are colored red. (C) Number of total known editing sites (red) and conserved (blue) since the identification of the first editing sites, until today. Identification of sites using next generation sequencing technologies began in 2009; this period is colored in gray. While the total number of editing sites increased by six orders of magnitude during this period, the number of conserved sites barely increased. (D) Hit enrichment for editing sites compared to SNPs using exactly the same pipeline shows high signal-to-noise ratio. The number of hits was normalized to all sites dataset sizes (left) and to non-Alu sites (right).
Figure 2
Figure 2
The size of the ESS is almost independent of data accumulation. (A) An accumulation curve of editing sites per strain (data derived from Danecek et al., whole brain samples). Strain datasets are sorted in ascending order of editing site amount (that is, the first strain contains the least number of editing sites, the second is the strain with the least additional editing sites, and so on). This result shows that addition of data does not lead to the addition of more conserved sites. (B-D) Visualization of sites per strain, ESS (B), random sites selected from all sites in the same proportion as the ESS (C), and all other sites (D). Editing signal is colored in yellow; sites with no data, that have, fewer than three reads are colored in gray, and sites with no evidence for editing are colored in blue. The heat-maps demonstrate a strong editing signal for conserved sites over all mice strains in contrast to the non-conserved sites.
Figure 3
Figure 3
Most of the ESS sites are located in a coding region or adjacent to such a site. (A) Genomic location of evolutionarily conserved sites. (B) Frequency of non-synonymous editing alterations in exonic sites for both groups demonstrates enrichment of sites that cause amino acid change in the ESS compared to the control (all other sites, P <2 × 10-11 calculated by Fisher’s exact test). (C-E) Secondary structure shows spatial proximity of coding and intron sites of GRIK2 (C), FLNA (D) and BLCAP (E) genes; editing sites are highlighted in orange and marked by an arrow.
Figure 4
Figure 4
Neighbor preferences for ESS and all sites. Nucleotide frequency for ESS (A), and all non-Alu sites (B). Both signatures are in agreement with the ADAR motif.
Figure 5
Figure 5
ESS exhibit significantly higher and more consistent editing levels and higher expression levels compared to all other sites. (A) Distribution of editing levels for ESS (black) and all other sites (white) (*P <10-6, Fisher’s exact test). (B) Mean editing levels for ESS versus all other sites (*P <7 × 10-22, Student’s two-tailed t-test). (C) Mean standard deviation for ESS and control (*P <4.6 × 10-8, two-tailed Student’s t-test). (D, E) ESS exhibits higher expression levels, as demonstrated by box plot (D) and by mean expression levels (E) (*P <10-28, two-tailed Student’s t-test).
Figure 6
Figure 6
A-to-I editing as a mechanism for the reversion of G-to-A evolution. All mouse editing sites were converted to human genome coordinates. G-to-A ratio was calculated and fixed as 1 (left). All human editing sites were converted to mouse genome coordinates; G-to-A ratio was calculated and normalized (right), exhibiting 1.66-fold enrichment compared to the mouse-to-human conversion. (*P = 10-7, Fisher’s exact test).
Figure 7
Figure 7
Editing and exonization in the SLC9A6 gene. (A) Schematic illustration of exons 12 to 14 of the SLC9A6 gene. Exons are depicted as blue boxes; the LINE inverted repeats are depicted as red boxes. Sense and antisense LINEs are expected to create a dsRNA secondary structure, thereby allowing RNA editing. The two editing sites are indicated in orange, revealing an R/G amino acid change. (B) Validation of editing by Sanger sequencing, genomic DNA (upper panel) and cDNA (lower panel) from the same individual; editing sites are marked by arrows.

Comment in

References

    1. Bass BL. RNA editing by adenosine deaminases that act on RNA. Annu Rev Biochem. 2002;71:817–846. doi: 10.1146/annurev.biochem.71.110601.135501. - DOI - PMC - PubMed
    1. Nishikura K. Functions and regulation of RNA editing by ADAR deaminases. Annu Rev Biochem. 2010;79:321–349. doi: 10.1146/annurev-biochem-060208-105251. - DOI - PMC - PubMed
    1. Savva YA, Rieder LE, Reenan RA. The ADAR protein family. Genome Biol. 2012;13:252. doi: 10.1186/gb-2012-13-12-252. - DOI - PMC - PubMed
    1. Danecek P, Nellaker C, McIntyre RE, Buendia-Buendia JE, Bumpstead S, Ponting CP, Flint J, Durbin R, Keane TM, Adams DJ. High levels of RNA-editing site conservation amongst 15 laboratory mouse strains. Genome Biol. 2012;13:26. doi: 10.1186/gb-2012-13-4-r26. - DOI - PMC - PubMed
    1. Rodriguez J, Menet JS, Rosbash M. Nascent-seq indicates widespread cotranscriptional RNA editing in Drosophila. Mol Cell. 2012;47:27–37. - PMC - PubMed

Publication types

MeSH terms

LinkOut - more resources