. 2014 Feb 21;289(8):5296-309.
doi: 10.1074/jbc.M113.537357. Epub 2014 Jan 6.

Identification of an L-phenylalanine binding site enhancing the cooperative responses of the calcium-sensing receptor to calcium

Affiliations

Identification of an L-phenylalanine binding site enhancing the cooperative responses of the calcium-sensing receptor to calcium

Chen Zhang et al. J Biol Chem. .

Abstract

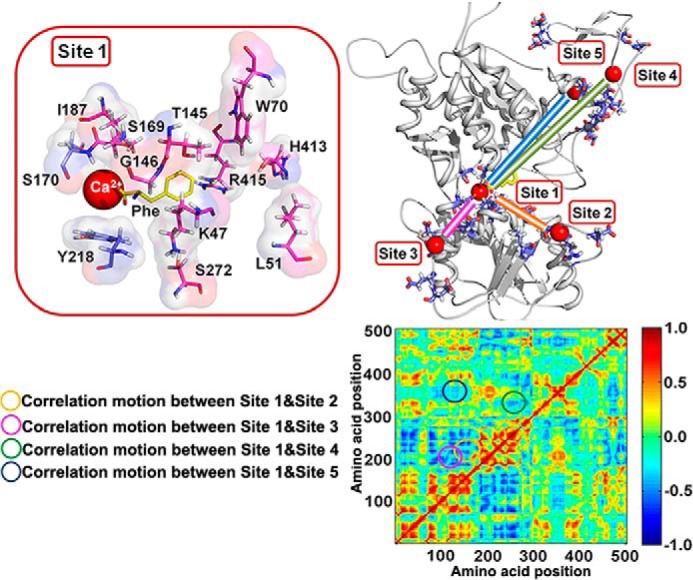
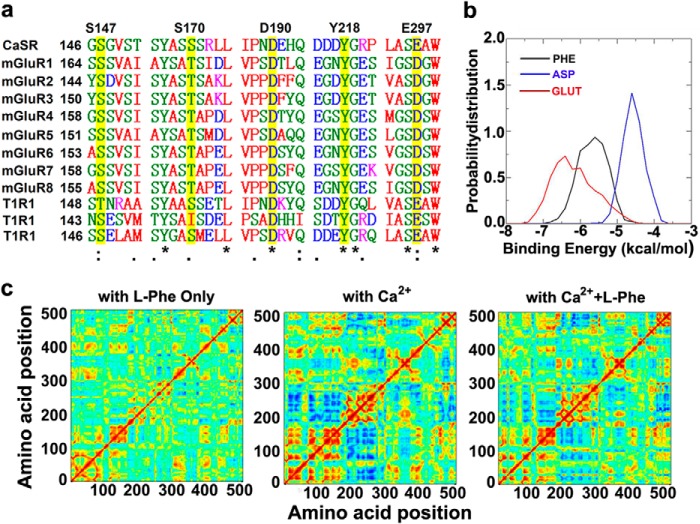
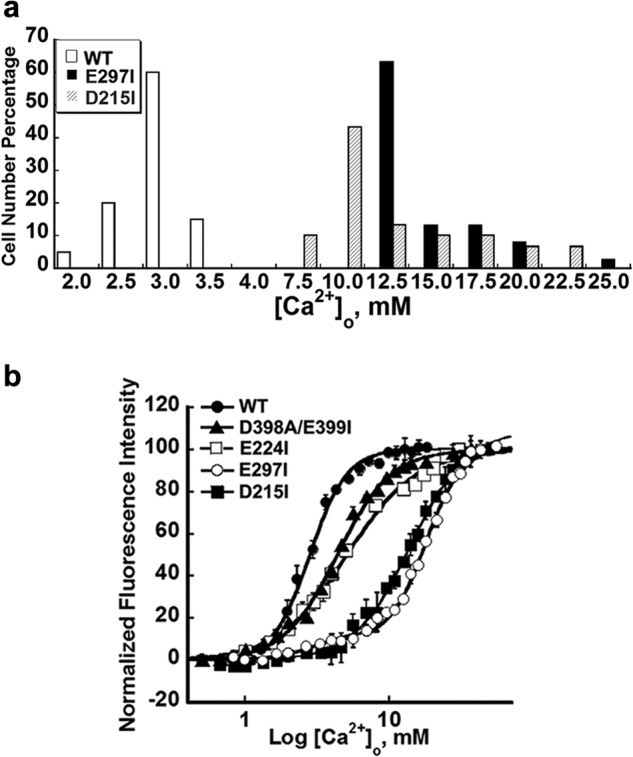
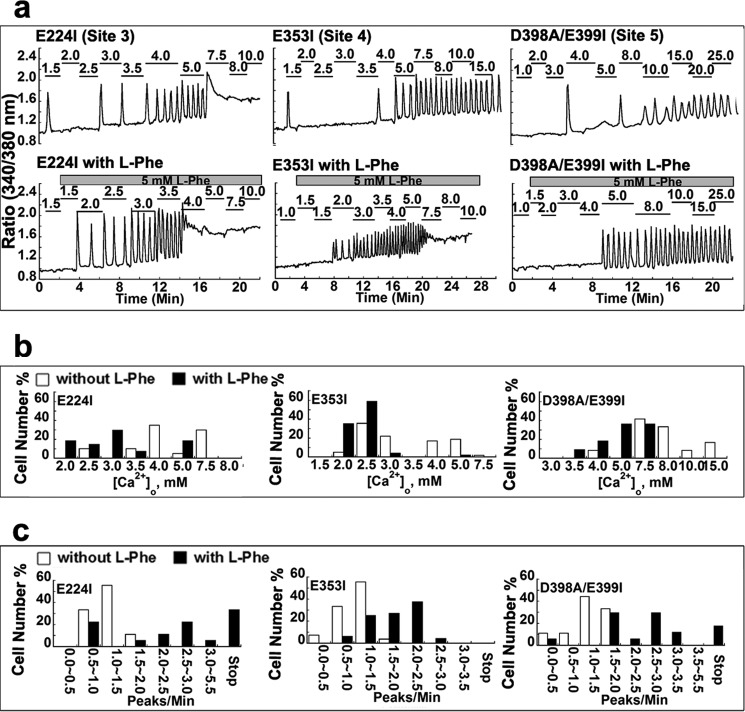
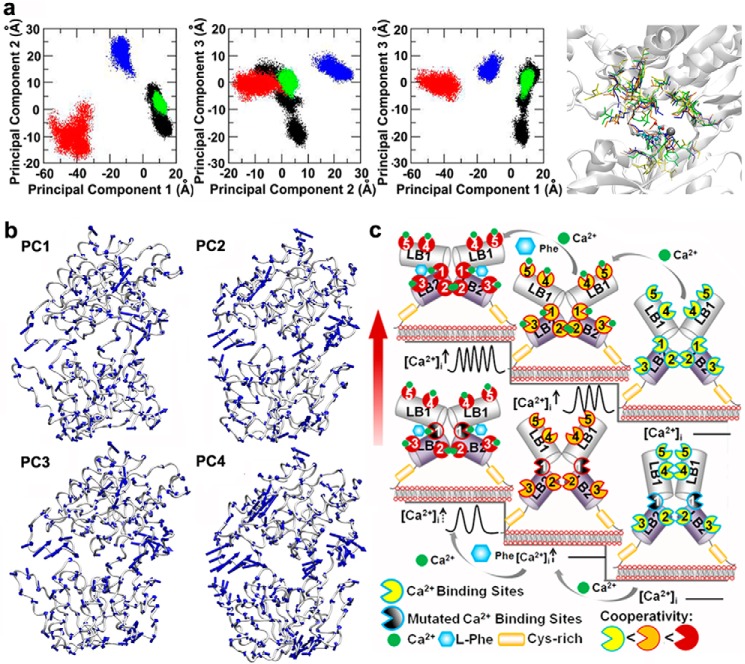
Functional positive cooperative activation of the extracellular calcium ([Ca(2+)]o)-sensing receptor (CaSR), a member of the family C G protein-coupled receptors, by [Ca(2+)]o or amino acids elicits intracellular Ca(2+) ([Ca(2+)]i) oscillations. Here, we report the central role of predicted Ca(2+)-binding site 1 within the hinge region of the extracellular domain (ECD) of CaSR and its interaction with other Ca(2+)-binding sites within the ECD in tuning functional positive homotropic cooperativity caused by changes in [Ca(2+)]o. Next, we identify an adjacent L-Phe-binding pocket that is responsible for positive heterotropic cooperativity between [Ca(2+)]o and L-Phe in eliciting CaSR-mediated [Ca(2+)]i oscillations. The heterocommunication between Ca(2+) and an amino acid globally enhances functional positive homotropic cooperative activation of CaSR in response to [Ca(2+)]o signaling by positively impacting multiple [Ca(2+)]o-binding sites within the ECD. Elucidation of the underlying mechanism provides important insights into the longstanding question of how the receptor transduces signals initiated by [Ca(2+)]o and amino acids into intracellular signaling events.

Keywords: Amino Acid; Calcium Imaging; Calcium Oscillation; Calcium Signaling; Calcium-sensing Receptor; Cooperativity; G Protein-coupled Receptors (GPCR).


Figures

FIGURE 1.
FIGURE 1.
Delineating the molecular connectivity associated with functional positive homotropic and positive heterotropic cooperativity within the CaSR ECD by molecular modeling of l-Phe- and Ca2+-binding sites. The model structure of the ECD of CaSR was based on the mGluR1 crystal structure (Protein Data Bank code 1ISR) and was generated using MODELER 9v4 and PyMOL. Upper right panel, five predicted Ca2+-binding sites are located in the ECD and are highlighted with frames. Residues involved in Ca2+-binding are shown in violet. Correlated motions among Ca2+-binding site 1 and the other Ca2+-binding sites are shown by lines of various colors. Upper panel, a zoomed in view of site 1; residues involved in the predicted l-Phe-binding site are highlighted in pink. Red, Ca2+; yellow, l-Phe. Lower panel, the correlation map of the modeled CaSR ECD structure. The correlation map is depicted based on MD simulations. The strongest negative correlation is given the value −1, whereas the strongest positive correlation is defined as +1. The circles on the correlation map reflect the movements between different binding sites (corresponding to the correlated motions in the upper right panel) during the MD simulation.
FIGURE 2.
FIGURE 2.
Sequence alignment and binding energy calculations based on the MD simulation of modeled CaSR ECD. a, sequence alignment of the orthosteric binding site for Glu in mGluR1 with CaSR and 10 other GPCRs of family C. Residues involved in predicted CaSR Ca2+-binding site 1 are labeled at the top, and corresponding residues in other group members are highlighted in yellow. b, the binding energies were calculated from molecular dynamics simulations and docking studies. Red line, CaSR-ECD docking with glutathione (GLUT); black line, CaSR-ECD docking with phenylalanine (PHE); blue line, CaSR-ECD docking with aspartic acid (ASP). c, the cross correlation matrices show the movements of residues during MD simulation. Positive values (in red) show residues moving in the same direction, whereas negative values (in blue) indicate residues moving away from one another.
FIGURE 3.
FIGURE 3.
Intracellular Ca2+ responses of CaSR mutants involving various Ca2+-binding sites following simulation with increases in [Ca2+]o. a, frequency distribution of the [Ca2+]i oscillation starting points in HEK293 cells transfected with WT, E297I, or D215I, respectively. The [Ca2+]o was recorded at the point when single cells started to oscillate. Approximately 30–60 cells were analyzed and further plotted as a bar chart. b, population assays of WT and Ca2+-binding site-related mutations. HEK293 cells transfected with CaSR or its mutants were loaded with Fura-2 AM. The intracellular Ca2+ level was assessed by monitoring emission at 510 nm with excitation alternately at 340 or 380 nm as described previously (30). The [Ca2+]i changes in the transfected cells were monitored using fluorimetry during stepwise increases in [Ca2+]o. The [Ca2+]i responses at various [Ca2+]o were plotted and further fitted using the Hill equation.
FIGURE 4.
FIGURE 4.
Individual cellular responses of mutants in calcium-binding sites to the indicated increments of [Ca2+]o in the presence or absence of l-Phe. a, representative intracellular calcium response from a single cell. Fura-2-loaded HEK293 cells expressing CaSR with mutations in calcium-binding site 3, 4, or 5 were prepared for single-cell experiments. Each experiment with or without 5 mm l-Phe began in the same non-calcium-containing Ringer buffer followed by stepwise increases in [Ca2+]o as indicated above the oscillation pattern using a perfusion system until [Ca2+]i reached a plateau (up to 30 mm [Ca2+]o). At least 30 cells were analyzed for each mutant. b, frequency distribution of the [Ca2+]o at which CaSR-transfected single HEK293 cells started to oscillate. The cell number percentage is defined as the number of cells starting to oscillate at a given [Ca2+]o/total cell number showing oscillation pattern × 100. Empty bar, in the absence of l-Phe; black bar, in the presence of 5 mm l-Phe. c, the frequency distribution of the oscillation frequency from single cells was investigated as described before. For experiments without l-Phe, the number of peaks/min was recorded at the level of [Ca2+]o at which the majority of the cells (>50%) started to oscillate; for experiments with 5.0 mm l-Phe, the frequency was analyzed at the same [Ca2+]o that was used in the absence of l-Phe. Specifically, the frequency of E224I was studied at 4 mm [Ca2+]o; E353I was analyzed at 5.0 mm [Ca2+]o; and D398A/E399I was investigated at 10.0 mm [Ca2+]o. Empty bar, in the absence of l-Phe; black bar, in the presence of 5 mm l-Phe.
FIGURE 5.
FIGURE 5.
Expression of WT CaSR and its mutants in HEK293 cells. a, Western blot analyses of CaSR and its mutants in transiently transfected HEK293 cells. 40 μg of total protein from cellular lysates were subjected to 8.5% SDS-PAGE. Three characteristic bands are shown in the upper panel, including the top band representing the dimeric receptor, the middle band showing mature glycosylated CaSR monomer (150 kDa), and the lowest band indicating immature glycosylated CaSR monomer (130 kDa). b, quantification of the expression of WT CaSR and its mutants in HEK293 cells. All the bands, including the one indicating dimeric receptor, mature glycosylated monomer and the one showing immature CaSR monomer, were taken into consideration. The internal control GAPDH was used to standardize CaSR expression, and the mutants were further normalized to the WT CaSR expression. c, immunofluorescence analyses of surface expressed WT CaSR and its mutants in HEK293 cells. Immunostaining was done with anti-CaSR monoclonal antibody ADD (70), and detection was carried out with Alexa Fluor 488-conjugated, goat anti-mouse secondary antibody. Red, propidium iodide staining of cell nuclei; green, CaSR. Equivalent expression of WT CaSR as well as its variants on the cell surface suggests that the difference in the Ca2+ sensing capabilities among the WT and mutant receptors are due to perturbation of the functions of cell surface receptors, rather than, for example, impaired trafficking of the receptor proteins to the cell surface.
FIGURE 6.
FIGURE 6.
Functional studies of receptors with mutations in l-Phe-binding site in HEK293 cells. a, representative oscillation pattern from a single cell. Each experiment with or without 5 mm l-Phe began in Ca2+-free Ringer buffer followed by stepwise increases in [Ca2+]o until [Ca2+]i reached a plateau (up to 30 mm [Ca2+]o). b, the pattern of [Ca2+]i responses in each cell (minimum of 30 cells) was analyzed, and the [Ca2+]o at which individual cells started to oscillate was recorded and plotted as a bar chart. c, the frequency of the oscillation patterns of the individual cells was investigated. For experiments without l-Phe, the number of peaks/min was recorded at the level of [Ca2+]o at which the majority of the cells (>50%) started oscillating, although for experiments with 5 mm l-Phe, the frequency was analyzed at the same levels of [Ca2+]o as in the corresponding experiments carried out without l-Phe. d, population assay for [Ca2+]i responses of HEK293 cells transiently overexpressing WT CaSR or CaSR mutants L51A or Y218Q using Fura-2 AM during stepwise increases in [Ca2+]o from 0.5 to 30 mm. The ratio of the intensity of light emitted at 510 nm upon excitation with 340 or 380 nm was normalized to its maximum response. The [Ca2+]o concentration response curves were fitted using the Hill equation.
FIGURE 7.
FIGURE 7.
Individual cellular responses of mutants in the l-Phe-sensitive site to the indicated increments of [Ca2+[rsqb]o in the presence or absence of l-Phe. HEK293 cells transfected with wild type CaSR or mutants were loaded with Fura-2 AM for 15 min. Each experiment with or without 5 mm l-Phe began in the same non-calcium-containing Ringer buffer followed by stepwise increases in [Ca2+]o until [Ca2+]i reached a plateau (up to 30 mm) as monitored by changes in the ratio of light emitted at 510 nm following excitation at 340 or 380 nm. At least 30 cells were analyzed for mutants S272A and T145A. Representative cellular responses from a single cell are shown.
FIGURE 8.
FIGURE 8.
[Ca2+[rsqb]i responses of CaSRs with mutations in the Ca2+-binding sites stimulated by increasing [Ca2+]o in the presence or absence of 5 mml-Phe. a, [Ca2+]i was monitored in mutants E297I and D215I in the absence or presence of l-Phe. [Ca2+]o was increased stepwise up to 30 mm or until [Ca2+]i reached a plateau. b, frequency distribution of [Ca2+]o at which CaSR-transfected single HEK293 cells started to oscillate. c, in the single-cell experiments, the frequency of the oscillation patterns was investigated in more than 30 cells. For experiments without l-Phe, the number of peaks/min was recorded at the level of [Ca2+]o at which the majority of the cells (>50%) started to oscillate, whereas for experiments with 5 mm l-Phe, the frequency was analyzed at the corresponding level of [Ca2+]o that was studied in the absence of l-Phe. Empty bar, in the absence of l-Phe; black bar, in the presence of 5 mm l-Phe. d, population assay for measuring [Ca2+]i responses of HEK293 cells transiently transfected with Ca2+-binding site-related CaSR mutants using Fura-2 AM during stepwise increases in [Ca2+]o from 0.5 to 30 mm. [Ca2+]i responses were further fitted using the Hill equation. Inset in top panel of d, zoomed in view of the binding first phase.
FIGURE 9.
FIGURE 9.
PCA of CaSR ECD, combined with experimental data, suggest a model for the mechanism underlying activation of the CaSR by extracellular Ca2+ and l-Phe. a, PCA of CaSR ECD. The trajectories of the molecular dynamics simulations were analyzed using PCA, which separates out the motions of the CaSR ECD into principal modes ranked according to their relative contributions. The first three principal modes were included in the present study to analyze four different states of the protein: ligand-free (black), presence of l-Phe-only (green), presence of Ca2+-only (red), or presence of both Ca2+ and l-Phe (blue). The superposition of the last snapshots of the aforementioned simulation systems is shown in the right panel. Ca2+ is shown as the black sphere; residues involved in Ca2+-binding site 1 are shown in bond representation; l-Phe is shown as a ball and stick model. b, representations of the four slowest principal components of the ECD of CaSR using the eigenvectors mapped onto the backbone C atoms of CaSR. The directions of the eigenvectors indicate the bending and twisting motions of the ECD of CaSR. c, model for the mechanism underlying activation of the CaSR by extracellular Ca2+ and l-Phe. Ca2+ and l-Phe modulate the activity as well as the cooperativity of CaSR (the color changes of the calcium binding sites from yellow to red indicates an increase in cooperativity). Higher [Ca2+]o, ∼3.0 mm, could change the conformation of CaSR into an active form (second stair level) in a positive homotropic cooperative manner (as indicated by the change of the color of the Ca2+-binding sites from yellow to orange) and further trigger [Ca2+]i oscillations. l-Phe binds to the hinge region between lobe 1 and lobe 2, modulating the receptor together with Ca2+ in a positive heterotropic cooperative way (as indicated by the change in the color from orange to red). This could produce a conformation of the receptor that is a “superactivated” form (third stair level) associated with a higher frequency of [Ca2+]i oscillations and a left-shifted EC50. CaSR mutants (lower activity stair level), especially those containing mutations close to the hinge region between lobe 1 (LB1) and lobe 2 (LB2) (show in black truncated circle), could cause a disruption of the cooperativity among the various Ca2+-binding sites (lower level, middle stair). [Ca2+]o at 3.0 mm does not trigger [Ca2+]i oscillations in the mutant CaSR. The impaired receptor function and the cross-talk between Ca2+-binding sites can be rescued, at least in part, by introducing l-Phe into the extracellular buffer (lower level, left stair). Red arrow, receptor activity.

Similar articles

Cited by

References

    1. Brown E. M., Gamba G., Riccardi D., Lombardi M., Butters R., Kifor O., Sun A., Hediger M. A., Lytton J., Hebert S. C. (1993) Cloning and characterization of an extracellular Ca2+-sensing receptor from bovine parathyroid. Nature 366, 575–580 - PubMed
    1. Chang W., Shoback D. (2004) Extracellular Ca2+-sensing receptors. An overview. Cell Calcium 35, 183–196 - PubMed
    1. Breitwieser G. E. (2006) Calcium sensing receptors and calcium oscillations. Calcium as a first messenger. Curr. Top. Dev. Biol. 73, 85–114 - PubMed
    1. Huang C., Miller R. T. (2007) The calcium-sensing receptor and its interacting proteins. J. Cell. Mol. Med. 11, 923–934 - PMC - PubMed
    1. Wellendorph P., Bräuner-Osborne H. (2009) Molecular basis for amino acid sensing by family C G-protein-coupled receptors. Br. J. Pharmacol. 156, 869–884 - PMC - PubMed

Publication types