. 2014 Feb 14;289(7):4387-94.
doi: 10.1074/jbc.M113.531632. Epub 2014 Jan 6.

Single molecule analysis reveals coexistence of stable serotonin transporter monomers and oligomers in the live cell plasma membrane

Affiliations

Single molecule analysis reveals coexistence of stable serotonin transporter monomers and oligomers in the live cell plasma membrane

Andreas Anderluh et al. J Biol Chem. .

Abstract

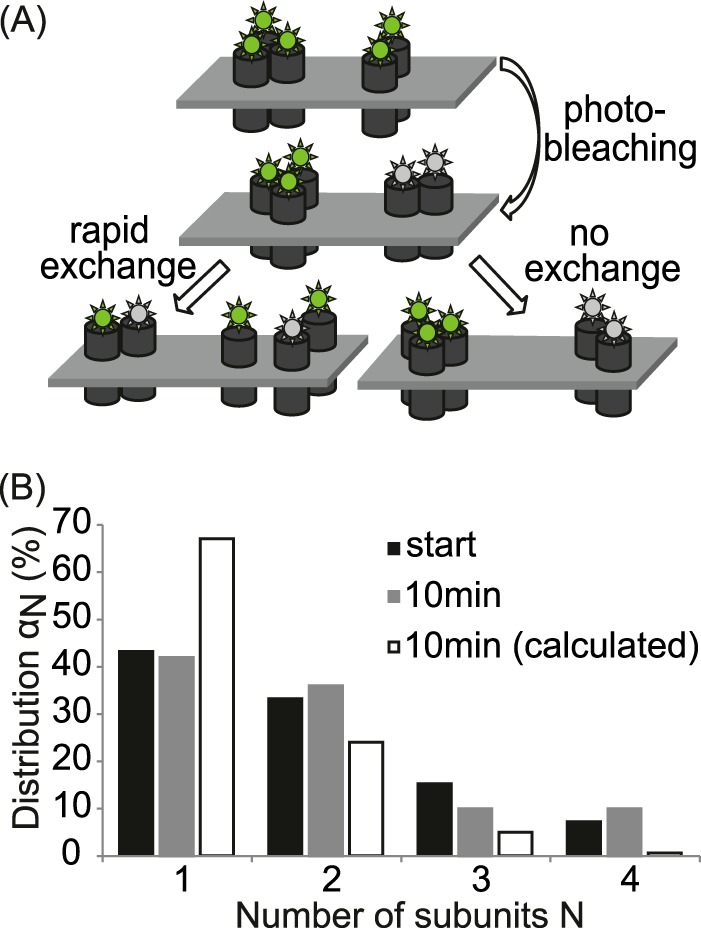
The human serotonin transporter (hSERT) is responsible for the termination of synaptic serotonergic signaling. Although there is solid evidence that SERT forms oligomeric complexes, the exact stoichiometry of the complexes and the fractions of different coexisting oligomeric states still remain enigmatic. Here we used single molecule fluorescence microscopy to obtain the oligomerization state of the SERT via brightness analysis of single diffraction-limited fluorescent spots. Heterologously expressed SERT was labeled either with the fluorescent inhibitor JHC 1-64 or via fusion to monomeric GFP. We found a variety of oligomerization states of membrane-associated transporters, revealing molecular associations larger than dimers and demonstrating the coexistence of different degrees of oligomerization in a single cell; the data are in agreement with a linear aggregation model. Furthermore, oligomerization was found to be independent of SERT surface density, and oligomers remained stable over several minutes in the live cell plasma membrane. Together, the results indicate kinetic trapping of preformed SERT oligomers at the plasma membrane.

Keywords: Membrane Proteins; Oligomerization; Protein Dynamics; Protein-Protein Interactions; Serotonin Transporters; Single Molecule Biophysics.


Figures

FIGURE 1.
FIGURE 1.
Mobility of SERT. A, to determine the mobile fraction of SERT, a fluorescence recovery after photobleaching experiment was performed on cells expressing mGFP-SERT. The integrated intensity of the bleached area (I) was normalized to the fluorescence intensity before bleaching (I0) and plotted over time (gray circles, showing a representative recovery curve). The fit yielded a mean mobile fraction of m = 82 ± 8% (n = 7). B, using single molecule tracking, the diffusion coefficient D was determined. Mean square displacements were calculated for a range of time lags (t lag), and D was determined from the first two points in the mean square displacement (msd) plot according to MSD = 4Dtlag + offset, yielding D = 0.151 ± 0.003 μm2/s.
FIGURE 2.
FIGURE 2.
Experimental strategy. A and B principle of the TOCCSL method. Ai, overlay of a white light image and the fluorescence image of a HEK 293 cell expressing mGFP-SERT. Using a field stop in the laser beam pathway, a region of interest (indicated by the dashed square) is chosen for the subsequent TOCCSL sequence. B, corresponding illumination protocol. Imaging was performed at low excitation power (∼0.8 kW/cm2) with an illumination time of 10 ms (for mGFP-SERT) or 5 ms (for JHC 1-64), whereas the bleach pulses 1 and 3 were performed at high excitation power (∼5 kW/cm2). After a prebleach image (ii) the region of interest was completely photobleached (laser pulse 1) at high excitation power for 800 ms. Sufficient bleaching was controlled by an image (iii) recorded immediately after laser pulse 1. During the recovery phase 2 (1500–3000 ms) unbleached SERT complexes enter the photobleached area by Brownian motion. In the image recorded after the recovery period (iv), single fluorescent complexes can now be distinguished as well separated diffraction-limited spots. To obtain the brightness of a single fluorophore, the complexes were bleached (bleach pulse 3, 100 ms) at high laser power followed by recording of an image. The shorter bleach pulse resulted in only partial bleaching of the complexes so that only single fluorescent dyes were left in each complex. C, obtained brightness distribution of the oligomeric fractions recorded in image iv plotted as probability density function (black line). The fit is shown as a dashed red line, the N-mer contributions as blue lines. D, normalized distribution of oligomeric states αN (black bars). The gray bars show the distribution after correcting for nonfluorescent mGFP-SERT, assuming a fluorescent fraction of 90%. The error bars indicate the values estimated for 80 and 100% active mGFP-molecules.
FIGURE 3.
FIGURE 3.
The fluorescent cocaine analog JHC 1-64 was used as an external label for SERT-expressing hS4TO cells. The brightness distribution of the labeled complexes was evaluated as described for mGFP-SERT. A, comparison of oligomeric states of SERT labeled with JHC 1-64 (black bars) and mGFP-SERT (gray bar) is shown. No substantial difference was found using the two labeling methods. Data were fitted with a linear aggregation model (green line), yielding Kc = 0.62. B, to further confirm the presence of higher oligomeric structures a stepwise bleaching approach was performed on JHC 1-64-labeled SERT fixed with paraformaldehyde. Exemplary bleach traces are shown for a monomer (top left), dimer (top right), trimer (bottom left), and tetramer (bottom right). The red lines indicate the photobleaching plateaus.
FIGURE 4.
FIGURE 4.
A, comparison of the oligomeric SERT distributions in the unaltered lipid environment of the plasma membrane (black bars) and after cholesterol depletion with cholesterol oxidase (2 units/ml for 30 min) is shown. No apparent influence of the cholesterol content is observable. B, surface density has no effect on the oligomeric state of SERT. The comparison of the two populations, high (black) and low surface density (gray) shows no difference in oligomerization. The mean density of SERT was evaluated by dividing the integrated fluorescent intensity of the cell membrane by the mean intensity of a monomer, yielding a mean density of ∼29 mGFP-SERT/μm2 for low surface density and ∼840 mGFP-SERT/μm2 for high surface density.
FIGURE 5.
FIGURE 5.
To evaluate the stability of the SERT complexes, 50% of the transporter complexes in a cell were stoichiometrically photobleached using a sequence of 10 TOCCSL experiments, then, the oligomeric distribution was monitored over 10 min. A, sketch showing the behavior of oligomeric structures after stoichiometric photobleaching. A transient interaction of SERT would lead to a rearrangement after photobleaching, resulting in a mixed population of bleached (gray) and unbleached (green) molecules per oligomer; in this case, the number of unbleached dyes per oligomer would be reduced (left). In contrast, stable interaction produces either completely bleached or unbleached oligomers, without effect on the distribution (right). B, oligomer distribution αN at the start of the experiment (black bars) and after 10 consecutive TOCCSL experiments performed every minute (gray bars). No change in the oligomeric distribution was observed. The white bars show the expected binomial distribution if the interaction kinetics of the subunits would be fast compared with the time of our experiment.

References

    1. Amara S. G., Kuhar M. J. (1993) Neurotransmitter transporters: recent progress. Annu. Rev. Neurosci. 16, 73–93 - PubMed
    1. Saier M. H., Jr., Tran C. V., Barabote R. D. (2006) TCDB: the Transporter Classification Database for membrane transport protein analyses and information. Nucleic Acids Res. 34, D181–186 - PMC - PubMed
    1. Masson J., Sagné C., Hamon M., El Mestikawy S. (1999) Neurotransmitter transporters in the central nervous system. Pharmacol. Rev. 51, 439–464 - PubMed
    1. Sitte H. H., Farhan H., Javitch J. A. (2004) Sodium-dependent neurotransmitter transporters: oligomerization as a determinant of transporter function and trafficking. Mol. Interv. 4, 38–47 - PubMed
    1. Kilic F., Rudnick G. (2000) Oligomerization of serotonin transporter and its functional consequences. Proc. Natl. Acad. Sci. U.S.A. 97, 3106–3111 - PMC - PubMed

Publication types

MeSH terms

Substances

LinkOut - more resources