. 2014:5:2977.
doi: 10.1038/ncomms3977.

microRNA-181a has a critical role in ovarian cancer progression through the regulation of the epithelial-mesenchymal transition

Affiliations
Free PMC article

microRNA-181a has a critical role in ovarian cancer progression through the regulation of the epithelial-mesenchymal transition

Aditya Parikh et al. Nat Commun. 2014.
Free PMC article

Abstract

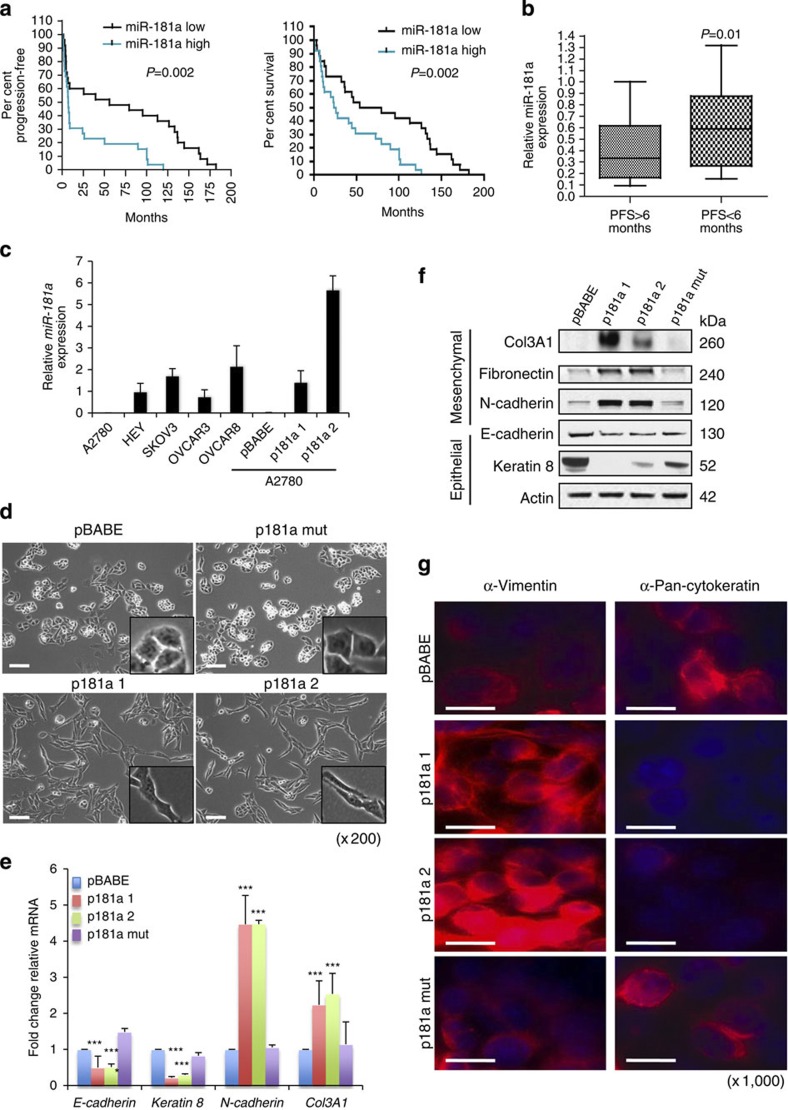
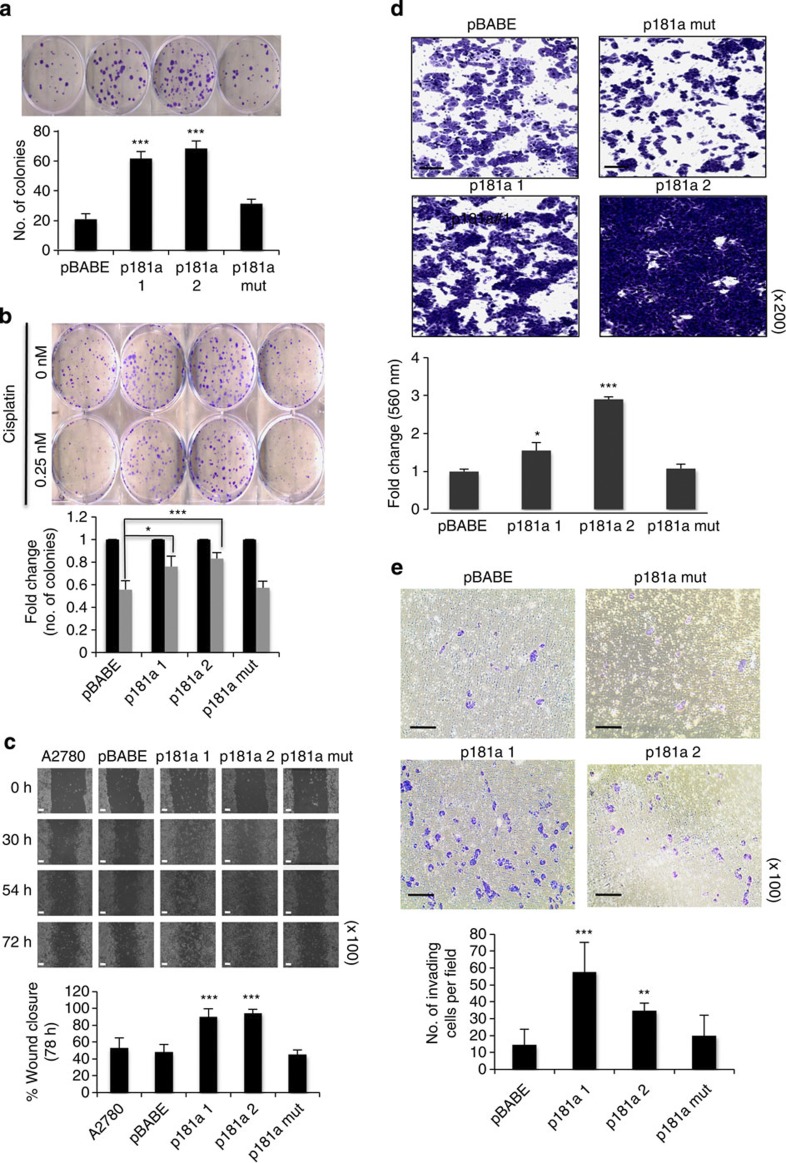
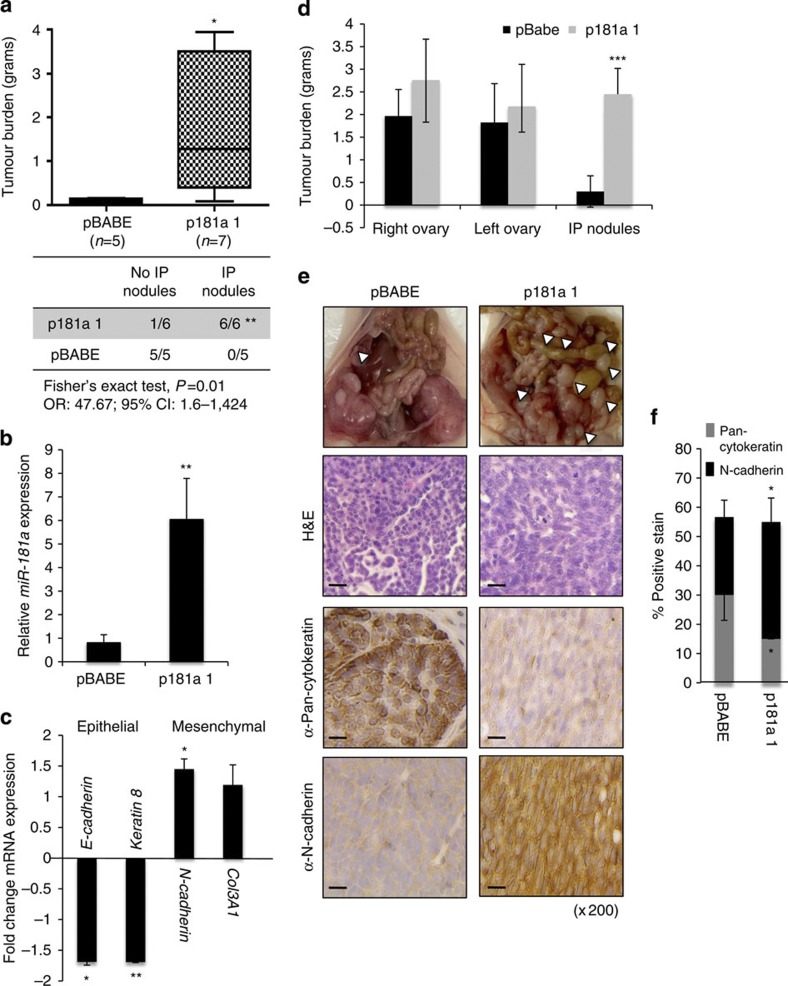
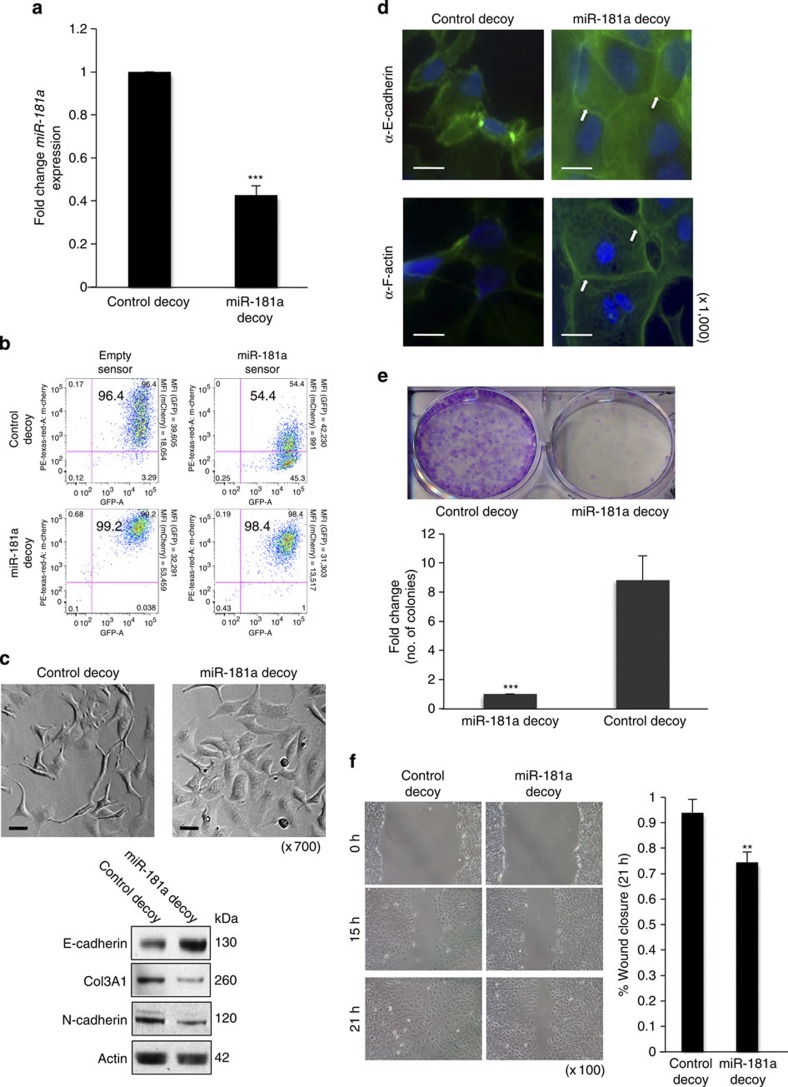
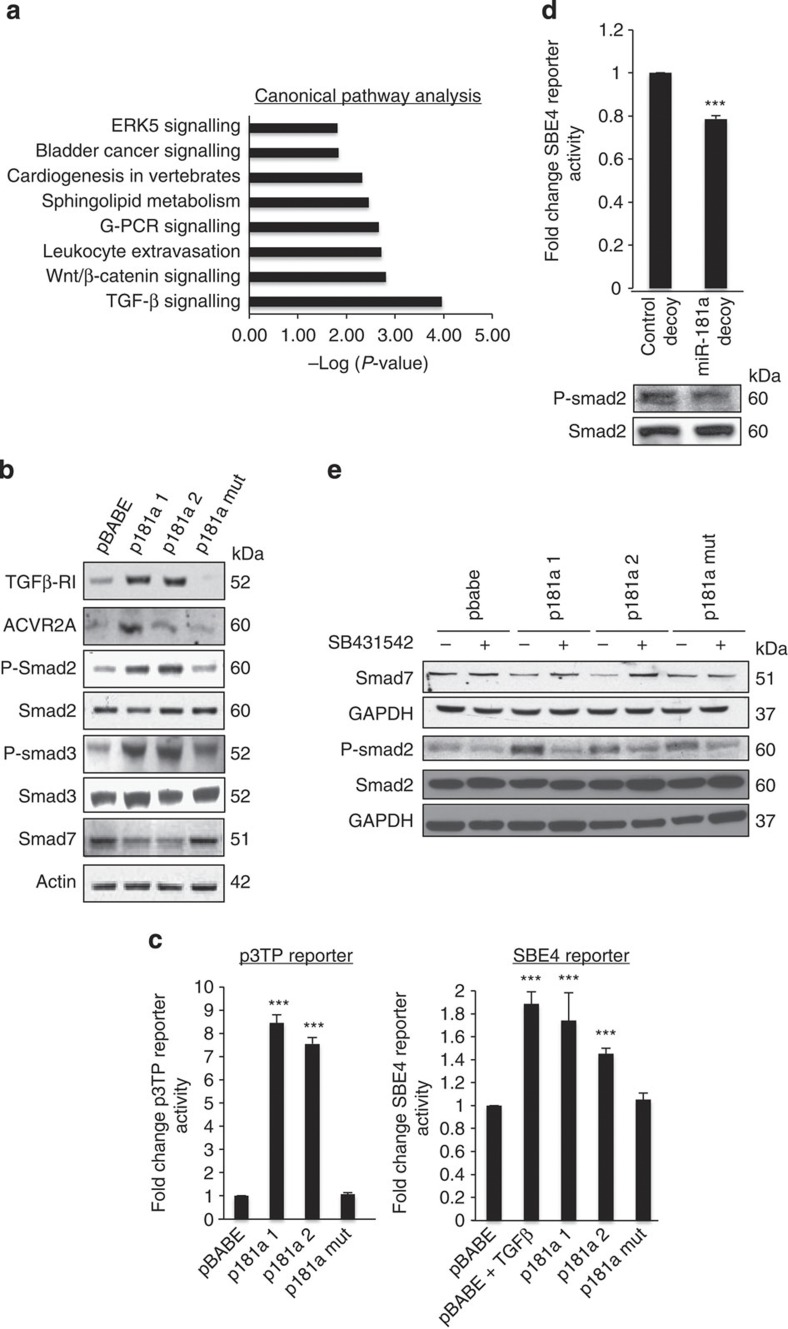
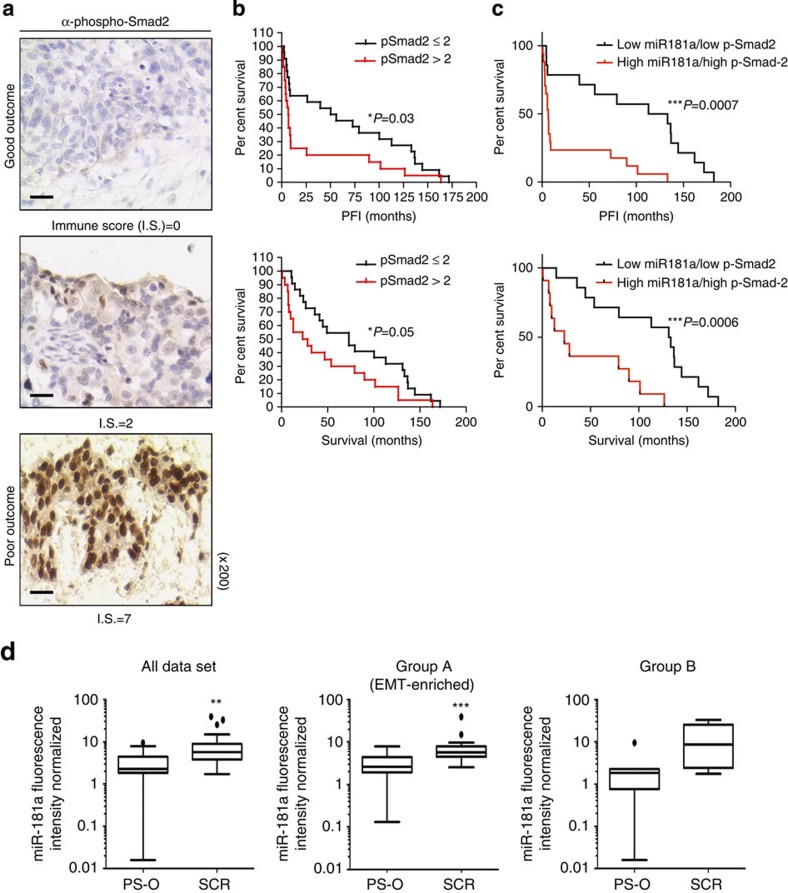
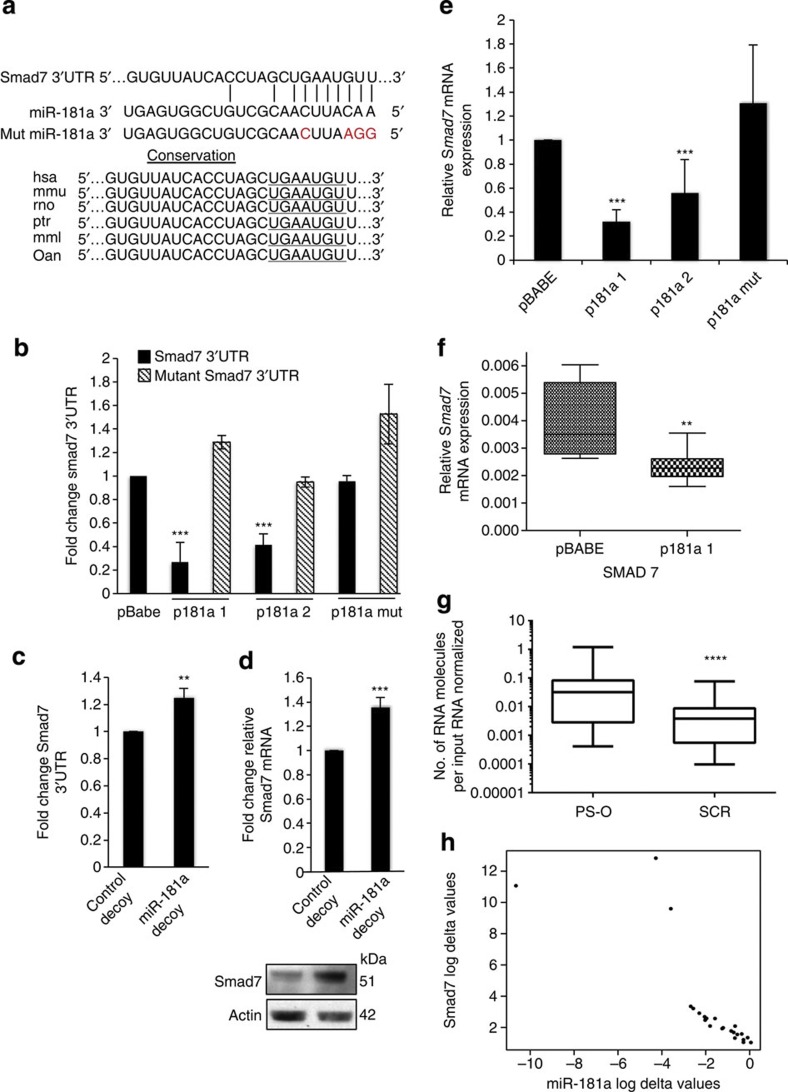
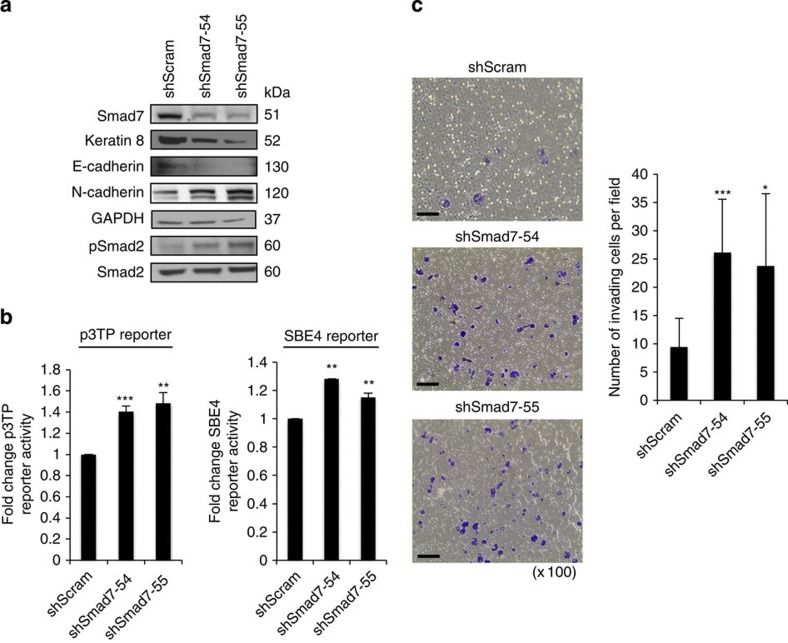
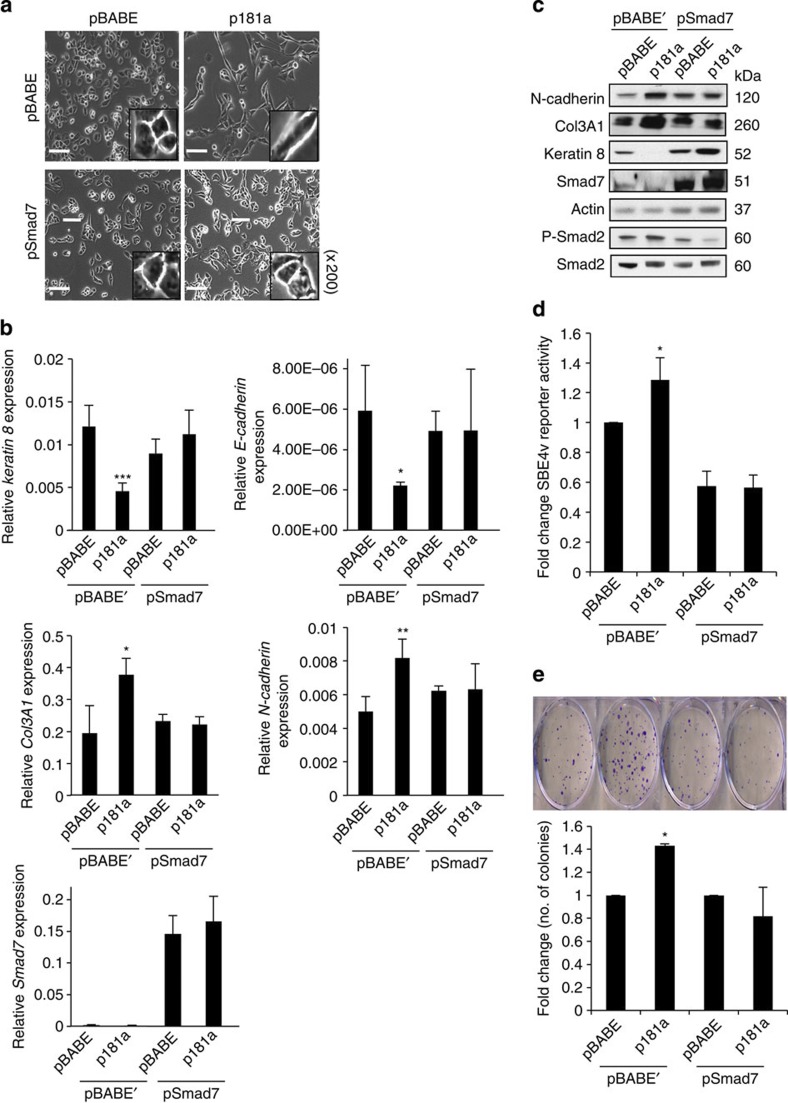
Ovarian cancer is a leading cause of cancer deaths among women. Effective targets to treat advanced epithelial ovarian cancer (EOC) and biomarkers to predict treatment response are still lacking because of the complexity of pathways involved in ovarian cancer progression. Here we show that miR-181a promotes TGF-β-mediated epithelial-to-mesenchymal transition via repression of its functional target, Smad7. miR-181a and phosphorylated Smad2 are enriched in recurrent compared with matched-primary ovarian tumours and their expression is associated with shorter time to recurrence and poor outcome in patients with EOC. Furthermore, ectopic expression of miR-181a results in increased cellular survival, migration, invasion, drug resistance and in vivo tumour burden and dissemination. In contrast, miR-181a inhibition via decoy vector suppression and Smad7 re-expression results in significant reversion of these phenotypes. Combined, our findings highlight an unappreciated role for miR-181a, Smad7, and the TGF-β signalling pathway in high-grade serous ovarian cancer.


Figures

Figure 1
Figure 1. miR-181a levels are associated with poor outcome and shorter time to recurrence in advanced epithelial ovarian cancer.
(a) Kaplan–Meier curves for PFS (left) and OS (right) in a cohort of patients (n=53) with stage-III primary ovarian serous adenocarcinoma according to relative expression levels of miR-181a (dichotomized at the median). P-values determined by log-rank statistical test. (b) Relative miR-181a levels in patient tumour specimens with PFS<6 months versus PFS>6 months (P=0.01, log-rank statistical test). (c) qRT–PCR analysis showing relative miR-181a expression levels in a panel of ovarian cancer cell lines and in A2780 p181a 1 and 2 cells. (n=3) Error bars, s.d. (d) Phase-contrast microscopic images of miR-181a-overexpressing cells versus control pBABE cells (original magnification, × 200, scale bars, 20 μM (white)). (e) Changes in the expression of epithelial and mesenchymal markers in miR-181a-overexpressing cells as measured by qRT–PCR. Student’s t-test, ***P≤0.001 (n=3). Error bars, s.d. and (f) western blotting. (g) Effects of miR-181a on pan-cytokeratin and vimentin (both in red (Texas Red) and blue (DAPI, 4',6-diamidino-2-phenylindole)) expression as evaluated by immunoflourescence (original magnification, × 1,000, scale bars, 5 μM (white)).
Figure 2
Figure 2. Enhanced expression of miR-181a increases migration and invasion.
(a) Clonogenic assay to assess the effects of miR-181a on cellular survival (b) and response to cisplatin. Colonies are shown in purple post staining with crystal violet (top). Student’s t-test, *P≤0.05, **P≤0.01 and ***P≤0.001 (n=3); NS, not significant. Error bars, s.d. (c) Wound-healing assay (top) to assess the effects of miR-181a on cellular motility by calculating per cent wound closure over time points shown (bottom). Original magnification, × 100, scale bars, 100 μM (white). Student’s t-test, ***P≤0.001 are shown (n=3). Error bars, s.d. (d) Additional assessment of the migratory potential using a transwell migration assay (four panels on top). Original magnification, × 200, scale bars, 50 μM (black). Student’s t-test, *P≤0.05 and ***P≤0.001 (n=3). Error bars, s.d. (e) Transwell invasion assay of miR-181a-expressing cells compared with control cell lines (four panels on top). Original magnification, × 100, scale bars, 100 μM (black). Student’s t-test, **P≤0.01 and ***P≤0.001 (n=3). Error bars, s.d.
Figure 3
Figure 3. miR-181a regulates EMT and increases tumour burden and incidence of metastasis in vivo.
(a) Total tumour burden (g) in pBABE (n=5) versus p181a-injected mice (n=7) at 3 weeks post i.p. injection (2 × 10⁶ cells; top). Fisher’s exact test correlating the incidence of intraperitoneal nodules with miR-181a expression (bottom); **P=0.01, OR: 46.76, 95% CI: 1.6–1424. (b) Confirmation of miR-181a expression in pBABE (n=5) versus p181a (n=7) cells isolated from harvested tissues as determined by qRT–PCR. Student’s t-test, **P≤0.01. Error bars, s.d. (c) Fold change of epithelial and mesenchymal marker expression as determined by qRT–PCR in miR-181a- (n=7) versus pBABE-injected (n=5) tumour cells. Student’s t-test, *P≤0.05 and **P≤0.01. Error bars, s.d. (d) Quantification of primary ovarian and intraperitoneal tumour burden in mice 3 weeks after intrabursal injection of both pBABE (n=5) versus p181a (n=5) tumour cells (1 × 10⁶ cells). Student’s t-test, ***P≤0.001. Error bars, s.d (e) Gross images of metastatic nodules (top; white arrows). Ovarian tumours have been removed from the p181a 1 mouse to observe the extensive dissemination of tumour nodules throughout the abdomen. Haematoxylin and eosin and IHC staining(s) for pan-cytokeratin and N-cadherin in representative pBABE and p181a 1 tumours. Original magnification, × 200, scale bars, 20 μM (black). (f) Quantification by immunoscoring as shown by percentage of positive staining for pan-cytokeratin and N-cadherin in pBABE (n=5) and p181a 1 (n=5) intraperitoneal tumours. Student’s t-test, *P≤0.05. Error bars, s.d.
Figure 4
Figure 4. Stable inhibition of miR-181a results in reduced cellular motility and survival.
(a) Fold change of miR-181a expression levels in SKOV3 cell line stably transduced with miR-181a TuD vector and a control decoy vector as assessed by qRT–PCR. Student’s t-test, ***P≤0.001 (n=3). Error bars, s.d. (b) Monitoring functional activity of miR-181a in SKOV3 miR-181a decoy transduced cells utilizing sensor vectors as measured via mean fluorescent intensity measurements using flow cytometry. (c) Morphological changes (top panels; original magnification, × 700, scale bars, 10 μM (black)) upon functional inhibition of miR-181a. Western blotting (bottom) for epithelial (E-cadherin) and mesenchymal markers (Col3A1 and N-cadherin) to confirm mesenchymal-to-epithelial transition. (d) Effects of miR-181a decoy on E-cadherin and F-actin organization (both shown in green (FITC, fluorescein isothiocyanate); blue (DAPI (4',6-diamidino-2-phenylindole)) for nuclear staining). Original magnification, × 1,000, scale bars, 5 μM (white). (e) Clonogenic assay (top) to assess cellular survival in miR-181a decoy cells shown as fold change in number of colonies in control versus miR-181a decoy cells (bottom). Colonies are shown in purple post staining with crystal violet. Student’s t-test, ***P≤0.001 are shown (n=3). Error bars, s.d. (f) Wound-healing assay (left) to evaluate cell motility in miR-181a decoy cells as quantified by per cent wound closure over time points shown (right). Original magnification, × 100, scale bars, 20 μM (black). Student’s t-test, **P≤0.01 (n=3). Error bars, s.d. (all results are shown for SKOV3 cells).
Figure 5
Figure 5. miR-181a is a novel modulator of the TGF-β signalling pathway in EOC.
(a) Global canonical pathway analysis. RNA-sequencing data sets from A2780 pBABE and p181a 1 cell lines were analysed using the Ingenuity Pathways Analysis software. Statistical significance is expressed as a P-value calculated using the right-tailed Fisher’s exact test. (b) Western blotting for the TGF-β receptor, activin receptor and Smad proteins assessing TGF-β pathway activity in miR-181a-overexpressing and control A2780 cells. (c) TGF-β transcriptional activity was assessed using both the firefly luciferase-based p3TP (left) and SBE4 (right) reporter constructs. Student’s t-test, ***P≤0.001 (n=3). Error bars, s.d. (d) SBE4 reporter activity (top) and phosphorylated Smad2 (P-Smad2) protein expression (bottom), as show by western blotting, in SKOV3 cells transduced with miR-181a decoy compared with the control decoy. Student’s t-test, ***P≤0.001 (n=3). Error bars, s.d. (e) Type-I TGF-β receptor (TGF-β RI) inhibitor, SB431542, effects on miR-181a-mediated activation of TGF-β signalling as measured by P-Smad2 protein expression and suppression of Smad7 protein expression as shown by western blotting.
Figure 6
Figure 6. miR-181a is upregulated in recurrent ovarian tumours and TGF-β activation correlates with poor patient outcome.
(a) IHC assessment of nuclear P-Smad2 expression in advanced EOC patients. Immune scores were established using the Allred scoring system (range 0–7). Original magnification, × 200, scale bars, 20 μM (black). (b) Kaplan–Meier curves derived from dichotomizing P-Smad2 expression at the median based on the immune scores show significant differences in PFS and OS. Differences in the PFS (top; P=0.03, OR: 7.9, 95% CI: 7.4–8.5) and median OS (bottom; P=0.05, OR: 2.9, 95% CI: 2.3–3.4; log-rank Mantel–Cox test) are shown. (c) Progression-free interval and OS outcomes in concomitant miR-181a and P-Smad2 expressions. Statistical significance was assessed for differences in PFI (P=0.0007) and PFS (P=0.0006; log-rank Mantel–Cox test) in patient samples with concomitant decrease versus increase in miR-181a and P-Smad2 expression (compared with the expression of each biomarker alone). (d) Box-plot diagrams showing the expression analysis of miR-181a in a clinical cohort of patient matched-tumour specimens from PS-O, primary surgery, ovary (naive to chemotherapy) and SCR, secondary surgery (after tumour has recurred and after two lines of chemotherapy). Left panel shows miR-181a expression in overall cohort collectively (P=0.0024, Wilcoxon signed-rank test); middle panel includes group A tumours, which have a TGF-β-mediated EMT-enriched gene signature (P=0.0006, Wilcoxon signed-rank test), and the right panel includes group B, which do not have an EMT gene signature. Within each box, the horizontal line indicates the median. The top edge of the boxes represents the 75th percentile and the bottom edge represents the 25th percentile (note the log scale on the ordinate). The range is shown as a vertical line ending above and below the 75th and 25th percentile values, respectively. Individual dots represent the outliers. **P<0.01 and ***P<0.001. Wilcoxon signed-rank test.
Figure 7
Figure 7. Smad7 is a novel functional target of miR-181a.
(a) Conservation of the miR-181a-targeting sites in the Smad7 3′UTR and the miR-181a mutant sequence that abrogates miR-181a binding to target mRNA. (b) Analysis of miR-181a modulation on wild-type or mutant Smad7 3′UTR luciferase reporter plasmid. Student’s t-test, ***P≤0.001 (n=3). Error bars, s.d. (c) Endogenous Smad7 mRNA expression as assessed by qRT–PCR in miR-181a-overexpressing and control A2780 cells. Student’s t-test, ***P≤0.001 (n=3). Error bars, s.d. (d) Smad7 3′UTR luciferase activity in SKOV3 cell lines with stable miR-181a inhibition. Student’s t-test, **P≤0.01 (n=3). Error bars, s.d. (e) Endogenous Smad7 mRNA expression as assessed by qRT–PCR in miR-181a knockdown and control decoy SKOV3 cells. Student’s t-test, ***P≤0.001 are shown (n=3). Error bars, s.d. (f) Relative Smad7 mRNA expression in tumour tissue extracted from athymic mice 3 weeks post i.p. injection of miR-181a or pBABE control cells (Box and Whiskers plot: min to max; **P<0.008, two-tailed Student t-test). (g) Smad7 mRNA expression in matched-primary (PS-O) versus recurrent (SCR) tumours. Wilcoxon signed-rank test, ****P<0.00001. (h) Correlation (r=−0.96, ****P<0.0001, Pearson’s correlation) between miR-181a and Smad7 expression in the matched-primary and recurrent ovarian tumours.
Figure 8
Figure 8. Stable inhibition of Smad7 mimics miR-181a-mediated events.
(a) Epithelial and mesenchymal marker expression in shScram (control) and two shSmad7 (-54 and -55) stable cell lines expressing different short hairpin RNA (shRNA) sequences. (b) p3TP (left) and SBE4-luc (right) reporter activities in the shScram, shSmad7-54 and shSmad7-55 cells. Student’s t-test, **P≤0.01 and ***P≤0.001 are shown (n=3). Error bars, s.d. (c) Analysis of invasive potential of the shScram, shSmad7-54 and -55 cell lines by a transwell invasion assay (left) and the quantification of invading cell counts per field (right). Original magnification, × 100, scale bars, 100 μM (black). Student’s t-test, *P≤0.05 and ***P≤0.001 (n=3). Error bars, s.d.
Figure 9
Figure 9. Functional validation of Smad7 effects on miR-181a-mediated EMT phenotypes.
(a) Phase-contrast microscopy images of A2780 cells overexpressing miR-181a or pBABE (control) in the presence and absence of Smad7 (lacking the 3′UTR) reconstitution. Original magnification, × 200, scale bars, 20 μM (white). (b) qRT–PCR analysis showing the relative expression epithelial (top) and mesenchymal marker expression (middle) and Smad7 (bottom) mRNA expression. Student’s t-test, *P≤0.05, **P≤0.01 and ***P≤0.001 (n=3). Error bars, s.d. (c) Epithelial and mesenchymal marker expression in the Smad7 rescue stable cell lines as measured by western blotting. (d) TGF-β signalling pathway activity as measured by SBE4 luciferase activity. Student’s t-test, *P≤0.05 (n=3). Error bars, s.d. (e) Colony-formation assays (top) to assess attenuation of miR-181a-mediated prosurvival phenotype in A2780 cells overexpressing Smad7 and pBABE’ control. Quantification (bottom) is shown as fold change in the number of colonies calculated to pBABE–pBABE or pBABE–pSmad7 controls. Student’s t-test, *P≤0.05 (n=3). Error bars, s.d.

Similar articles

Cited by

References

    1. Siegel R., Ward E., Brawley O. & Jemal A. Cancer statistics. Cancer J. Clin. 61, 212–216 (2011). - PubMed
    1. Seidman J. D. et al. Borderline ovarian tumors: diverse contemporary viewpoints on terminology and diagnostic criteria with illustrative images. Hum. Pathol. 35, 918–933 (2004). - PubMed
    1. Yang D. et al. Intregrated analyses identify a master microRNA regulatory network for the mesenchymal subtype in serous ovarian cancer. Cancer Cell 23, 186–199 (2013). - PMC - PubMed
    1. Kumar M. S., Lu J., Mercer K. L., Golub T. R. & Jacks T. Impaired microRNA processing enhances cellular transformation and tumorigenesis. Nat. Genet. 39, 673–677 (2007). - PubMed
    1. Mateescu B. et al. miR-141 and miR-200a act on ovarian tumorigenesis by controlling oxidative stress response. Nat. Med. 17, 1627–1635 (2011). - PubMed

Publication types

MeSH terms