. 2014:5:3051.
doi: 10.1038/ncomms4051.

A molecular brake controls the magnitude of long-term potentiation

Affiliations

A molecular brake controls the magnitude of long-term potentiation

Yubin Wang et al. Nat Commun. 2014.

Abstract

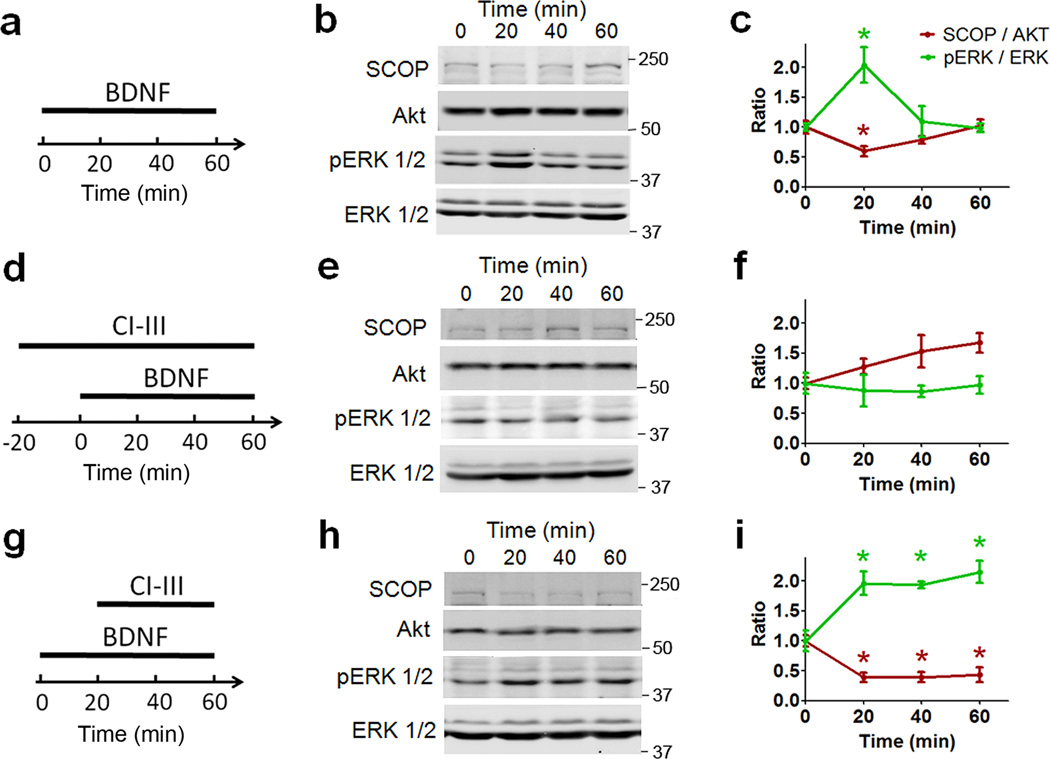
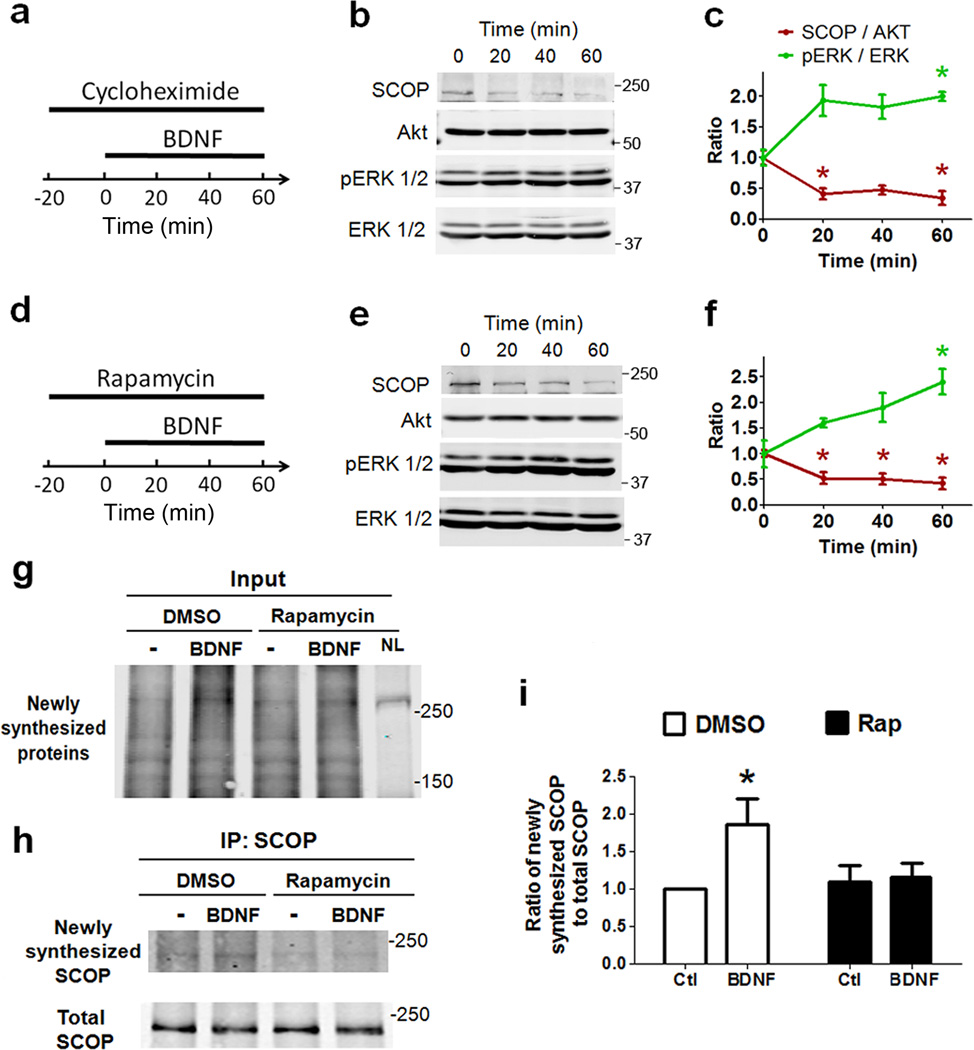
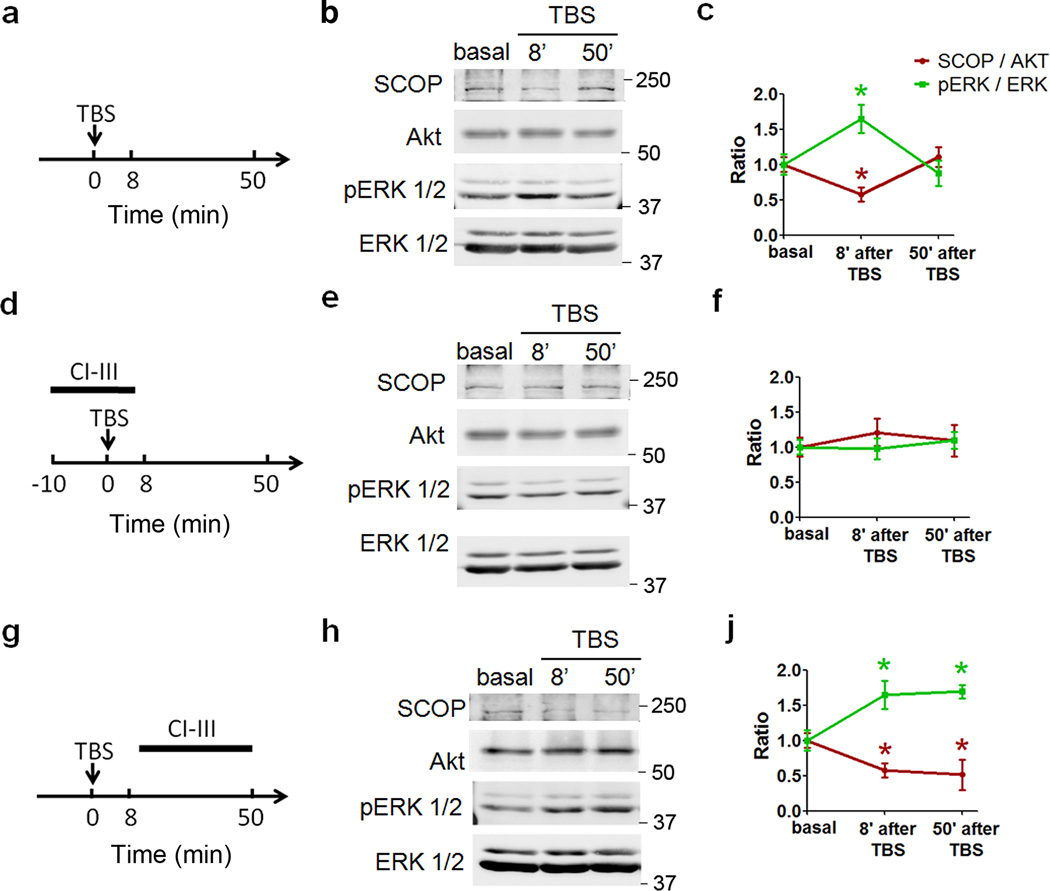
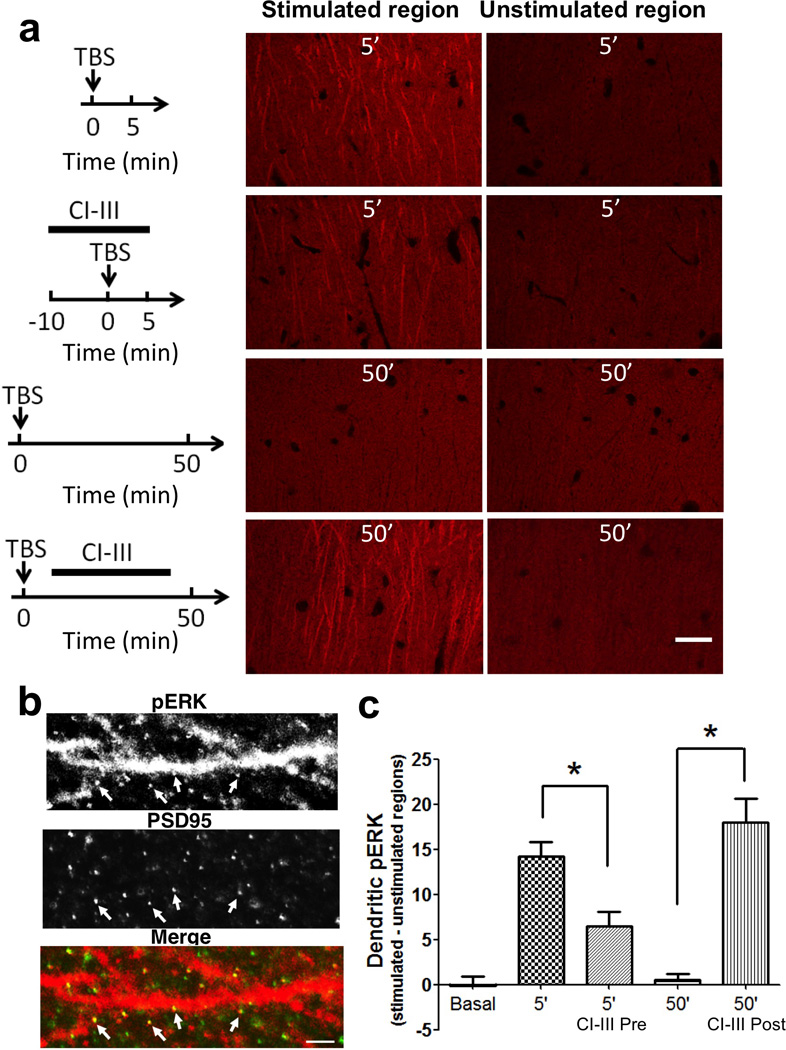
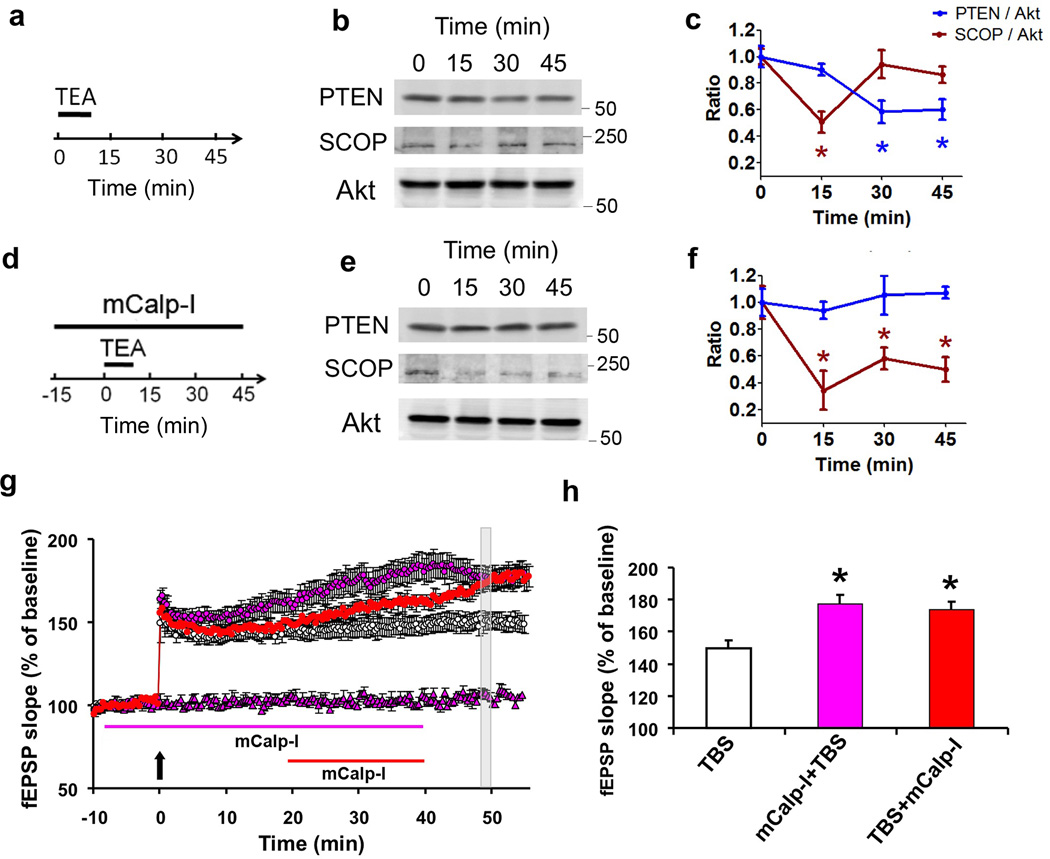
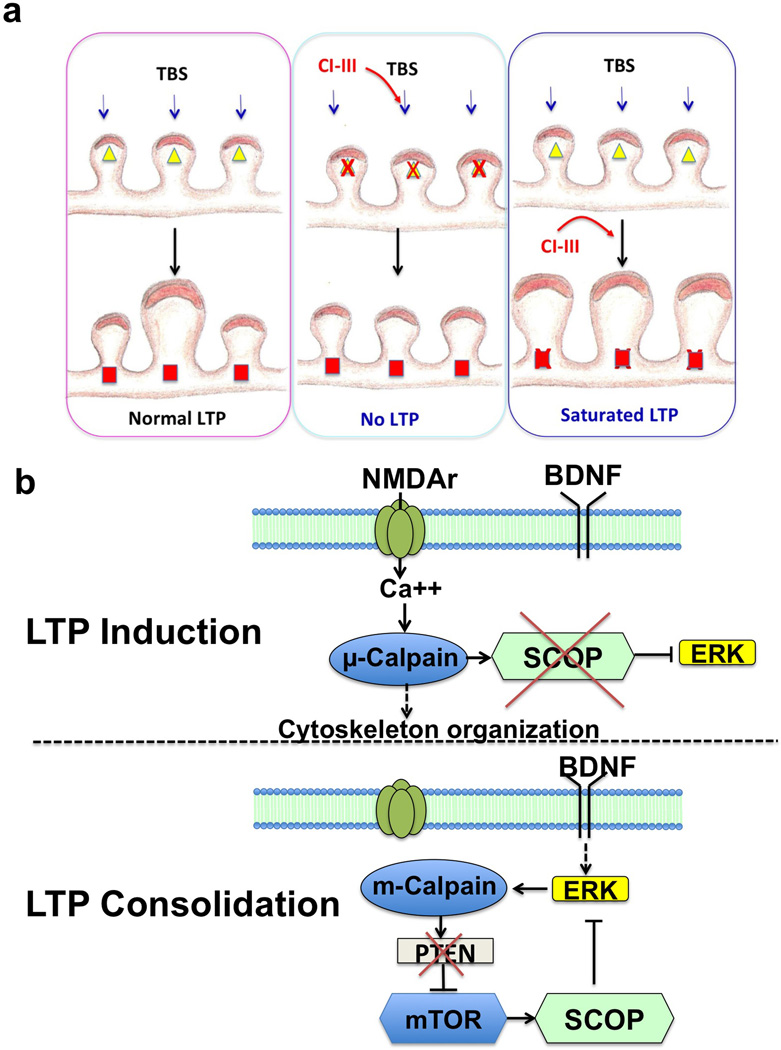
Overexpression of suprachiasmatic nucleus circadian oscillatory protein (SCOP), a negative ERK regulator, blocks long-term memory encoding. Inhibition of calpain-mediated SCOP degradation also prevents the formation of long-term memory, suggesting rapid SCOP breakdown is necessary for memory encoding. However, whether SCOP levels also control the magnitude of long-term synaptic plasticity is unknown. Here we show that following synaptic activity-induced SCOP degradation, SCOP is rapidly replaced via mTOR-mediated protein synthesis. We further show that early SCOP degradation is specifically catalysed by μ-calpain, whereas late SCOP resynthesis is mediated by m-calpain. We propose that μ-calpain promotes long-term potentiation induction by degrading SCOP and activating ERK, whereas m-calpain activation limits the magnitude of potentiation by terminating the ERK response via enhanced SCOP synthesis. This unique braking mechanism could account for the advantages of spaced versus massed training in the formation of long-term memory.


Figures

Figure 1
Figure 1. Effects of calpain inhibitor III on BDNF-induced changes in levels of SCOP and p-ERK
a, d, g. Experimental protocols: hippocampal slices were prepared from adult rats and were treated with BDNF (100 ng/ml) for the indicated periods of time in the absence or presence of calpain inhibitor III (10 µM), as indicated. b, e, h. Representative western blots for SCOP, Akt, p-ERK and ERK under various experimental conditions. c, f, i. Quantitative analysis of the levels of SCOP (normalized to the values of Akt) and p-ERK/ERK ratios under various experimental conditions. In all cases, results are means ± S.E.M. of 3 experiments. * p < 0.05, as compared to time point 0, one-way ANOVA followed by Bonferroni test.
Figure 2
Figure 2. Effects of cycloheximide and rapamycin on BDNF-induced changes in levels of SCOP and p-ERK
a, d, Experimental design: hippocampal slices were treated with BDNF (100 ng/ml) for the indicated periods of time in the presence of cycloheximide (25 µM) or rapamycin (1 µM). b, e, Representative western blots for SCOP, Akt, p-ERK and ERK under various experimental conditions. c, f. Quantitative analysis of the levels of SCOP (normalized to the values of Akt) and p-ERK/ERK ratios under various experimental conditions. In all cases, results are means ± S.E.M. of 3 experiments. * p < 0.05, as compared to time point 0, one-way ANOVA followed by Bonferroni test. g, Representative blot for all newly synthesized (biotin-labeled) proteins larger than 150 kDa from synaptoneurosomes before immunoprecipitation (input) as detected by IRDye® 800CW Streptavidin. Note that the second lane (BDNF-treated sample) shows denser labeling than the other lanes. NL (not-labeled) line is from naïve synaptoneurosomes without metabolic labeling (negative control). h, Representative western blots for newly synthesized (biotin-labeled) and total SCOP, after treatment of cortical synaptoneurosomes with BDNF (100 ng/ml) in the absence or presence of rapamycin (1 µM) and subsequent immunoprecipitation with SCOP antibody. i, Quantitative analysis of the levels of newly synthesized SCOP (normalized to total SCOP). Data are means ± S.E.M. of 4 experiments. * p < 0.05, as compared to control, two-way ANOVA followed by Bonferroni test.
Figure 3
Figure 3. Effects of calpain inhibition on TBS-induced changes in adult hippocampal CA1 mini-slices
a, d, g. Experimental protocol: hippocampal CA1 mini-slices were prepared from adult rats and were stimulated by TBS in the absence or presence of calpain inhibitor III (10 µM), as indicated. b, e, h. Representative western blots for SCOP, Akt, p-ERK and ERK under various experimental conditions. c, f, i. Quantitative analysis of the levels of SCOP (normalized to the values of Akt) and p-ERK/ERK ratios under various experimental conditions. Results are means ± S.E.M. of 3–8 experiments. * p < 0.05, as compared to time point 0, one-way ANOVA followed by Bonferroni test.
Figure 4
Figure 4. TBS-induced ERK activation is differentially affected by pre- or post-TBS calpain inhibitor III treatment
Hippocampal slices were prepared from adult rats and subjected to various experimental conditions. At the indicated times, slices were fixed, re-sectioned and processed for immunohistochemistry for p-ERK. Images of stimulated and unstimulated regions from two most representative sections of each slice were chosen for analysis. a. Representative images. Top: p-ERK immunoreactivity at 5 min after TBS (10 bursts of 4 pulses (100 Hz) delivered at 5 Hz) in slices treated with vehicle or calpain inhibitor III (10 µM) for 10 min before and continued for 5 min after TBS. Bottom: p-ERK immunoreactivity at 50 min after TBS in slices treated with vehicle or calpain inhibitor III (10 µM) for 30 min starting 10 min after TBS. Scale bar: 20 µm. b. High magnification images of dendrites in stimulated region double-stained with p-ERK and PSD-95 antibodies, showing the co-localization of p-ERK and PSD-95 (arrows). Scale bar: 2 µm. c. Quantitative analysis of p-ERK immunostaining. The average p-ERK intensity was determined in a 120×60 µm area in the dendritic field of CA1. Image intensities from stimulated regions were subtracted from those of unstimulated regions of the same slice to correct for slice-to-slice variation in staining intensity, as described in. Shown are means ± S.E.M. of n = 8. * p < 0.01, one-way ANOVA followed by Bonferroni test.
Figure 5
Figure 5. Effects of calpain inhibition at various times before or after LTP induction
a. Time-dependent effects of calpain inhibition on LTP. Hippocampal slices were prepared from adult rats and LTP was induced in field CA1 by TBS (black arrow). Vehicle or calpain inhibitor III (10 µM) was applied for 10 min before and continued 5 min after TBS (cyan). Alternatively, calpain inhibitor III (10 µM) was applied for 30 min starting 10 min (blue) or 60 min (magenta) post-TBS. Slopes of field EPSPs (fEPSPs) are expressed as percent of the average values recorded during the 10 min baseline (means ± S.E.M. of 5–10 slices from 3–5 animals). Basal synaptic transmission did not change during the recording period (red). b. Representative traces for fEPSPs recorded at the indicated time-points (1, 2, and 3), under different experimental conditions. Calibration: 0.5 mV/5 msec. c. Post-TBS calpain inhibition blocks TBS2-induced further potentiation. TBS was applied as indicated by arrows. Calpain inhibitor III (10 µM) was applied during the time indicated by the horizontal lines. A second TBS was delivered 60 min after the first TBS and fEPSP was recorded for an additional 40 min (means ± S.E.M of 6–8 slices from 3–4 animals). d. Top: Calpain inhibitor III (10 µM) was applied for 30 min starting 10 min after TBS1 (arrow). At the end of calpain inhibitor treatment, stimulation intensity was decreased to obtain a response equivalent to the pre-TBS value. After 20 min, TBS2 was delivered and responses recorded for an additional 40 min (representative experiment). Bottom: Calpain inhibitor III (10 µM) was applied to naïve slices for 30 min. After 20 min, TBS was applied and responses recorded for an additional 40 min (representative experiment). e. Comparison of the responses highlighted in d (means ± S.E.M. of 6–8 slices).
Figure 6
Figure 6. ERK inhibition prevents and mTOR inhibition mimics calpain inhibition-induced LTP enhancement
Hippocampal slices were prepared from adult rats and LTP was induced by TBS as under Fig. 1. The MEK inhibitors PD98059 (5 µM) (a) or U0126 (5 µM) (b) were applied together with calpain inhibitor III (10 µM) for 30 min. The data for the grey symbols in a and b, which were used as the reference, are from Fig.5a (blue symbol). In all cases, the slopes of the field EPSPs are expressed as percent of the average values recorded during the 10 min baseline, and are means ± S.E.M. of 5–10 slices prepared from 3–5 animals. c. Effects of rapamycin (1 µM) applied for 30 min (horizontal bar) starting at 10 min after TBS on hippocampal LTP. d. Summary of the amplitude of LTP measured within the gray area corresponding to 49–50 min after TBS (Note that the data for TBS and TBS + CI–III are from Fig. 5a). * p < 0.01 as compared to TBS alone; § p < 0.01 as compared to TBS + Calpain inhibitor III (one-way ANOVA followed by Bonferroni test). The slopes of the fEPSPs are expressed as percent of the average values recorded during the 10 min baseline, and are means ± S.E.M. of 5–10 slices prepared from 3–5 animals.
Figure 7
Figure 7. Effects of an m-calpain specific inhibitor on TEA-mediated SCOP and PTEN degradation and on LTP
a–f: Hippocampal slices were prepared from adult rats and were treated with TEA (20 mM) for 10 min, and collected at the indicated times. TEA and mCalp-I (200 nM) were applied as shown in a and d. b and e: Representative western blots for SCOP, PTEN and Akt at the indicated times. c and f: Quantitative analysis of the levels of SCOP and PTEN (normalized to the values of Akt). In all cases, results are means ± S.E.M. of 3 experiments. * p < 0.05, as compared to time point 0, one-way ANOVA followed by Bonferroni test. g–h. Effects of mCalp-I on TBS-induced LTP. mCalp-I (200 nM) was applied either before TBS (vertical arrow) (blue circles) or 20 min after TBS (red circles). mCalp-I alone had no effect on baseline responses (blue triangles). h. Summary of the amplitude of LTP measured within the gray area corresponding to 49–50 min after TBS. * p < 0.01 as compared to TBS alone.
Figure 8
Figure 8. Schematic representation of the functions of µ- and m-calpain in LTP induction and consolidation
a. µ-calpain activation is necessary for synaptic potentiation during LTP induction, and its inhibition prevents LTP (middle panel). m-calpain activation during consolidation limits the extent of synaptic potentiation and its inhibition results in enhanced LTP (right panel). µ-calpain activation is indicated by yellow triangles and m-calpain by red squares. Calpain inhibitor III (CI–III) application is indicated by red arrows. Note that we also postulate that µ-calpain and m-calpain are differentially localized in synapses. b. Signaling pathways downstream of µ- and m- calpain in LTP induction and consolidation. In LTP induction, µ-calpain activation, possibly resulting from Ca2+ influx through the NMDA receptors, results in SCOP truncation followed by ERK activation. In the consolidation period, m-calpain activation, possibly resulting from BDNF-mediated ERK activation stimulates mTOR-dependent protein synthesis through calpain-mediated PTEN degradation, and in particular SCOP synthesis, which would restore normal SCOP levels, thereby preventing ERK activation.

Similar articles

Cited by

References

    1. Morris RG, et al. Elements of a neurobiological theory of the hippocampus: the role of activity-dependent synaptic plasticity in memory. Philos Trans R Soc Lond B Biol Sci. 2003;358:773–786. - PMC - PubMed
    1. Jin SX, Feig LA. Long-term potentiation in the CA1 hippocampus induced by NR2A subunit-containing NMDA glutamate receptors is mediated by Ras-GRF2/Erk map kinase signaling. PLoS One. 2010;5:e11732. - PMC - PubMed
    1. Kelleher RJ, 3rd, Govindarajan A, Jung HY, Kang H, Tonegawa S. Translational control by MAPK signaling in long-term synaptic plasticity and memory. Cell. 2004;116:467–479. - PubMed
    1. Winder DG, et al. ERK plays a regulatory role in induction of LTP by theta frequency stimulation and its modulation by beta-adrenergic receptors. Neuron. 1999;24:715–726. - PubMed
    1. Shimizu K, Okada M, Nagai K, Fukada Y. Suprachiasmatic nucleus circadian oscillatory protein, a novel binding partner of K-Ras in the membrane rafts, negatively regulates MAPK pathway. J Biol Chem. 2003;278:14920–14925. - PubMed

Publication types