. 2014 Jan 1;28(1):71-84.
doi: 10.1101/gad.231050.113.

The multifork Escherichia coli chromosome is a self-duplicating and self-segregating thermodynamic ring polymer

Affiliations

The multifork Escherichia coli chromosome is a self-duplicating and self-segregating thermodynamic ring polymer

Brenda Youngren et al. Genes Dev. .

Abstract

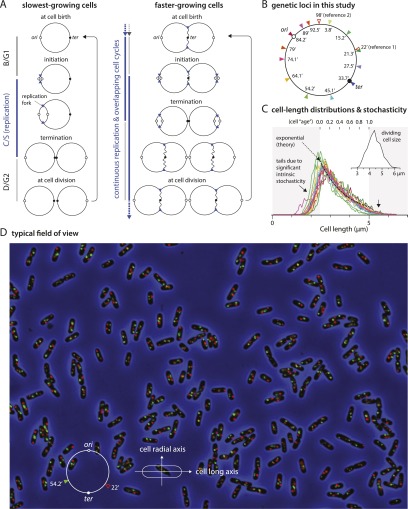
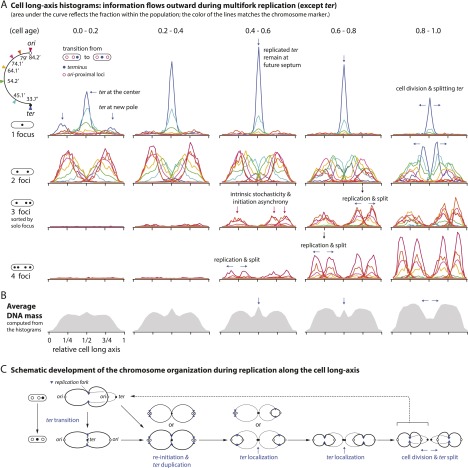
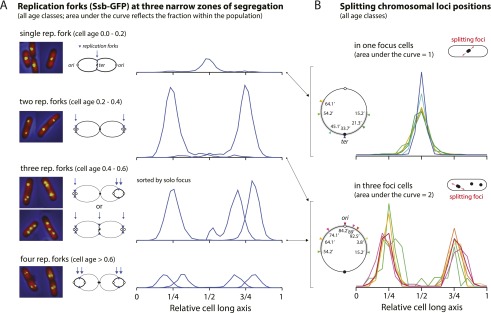
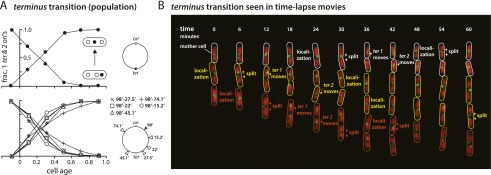
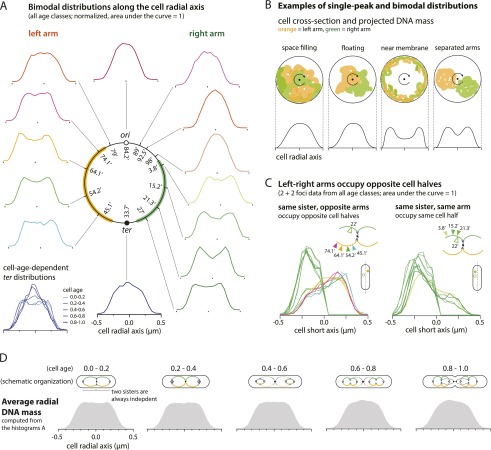
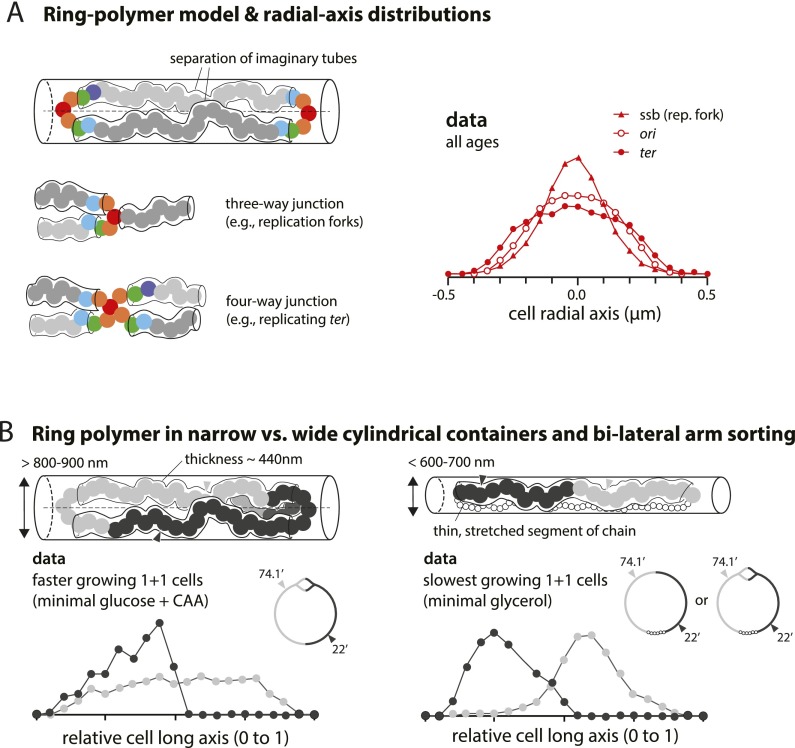
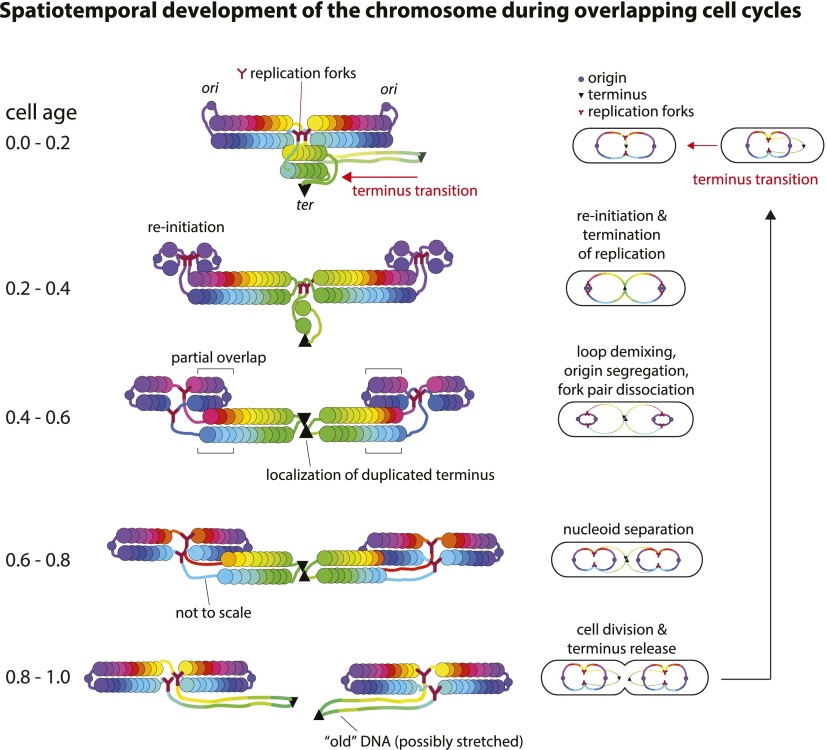
At all but the slowest growth rates, Escherichia coli cell cycles overlap, and its nucleoid is segregated to daughter cells as a forked DNA circle with replication ongoing-a state fundamentally different from eukaryotes. We have solved the chromosome organization, structural dynamics, and segregation of this constantly replicating chromosome. It is locally condensed to form a branched donut, compressed so that the least replicated DNA spans the cell center and the newest DNA extends toward the cell poles. Three narrow zones at the cell center and quarters contain both the replication forks and nascent DNA and serve to segregate the duplicated chromosomal information as it flows outward. The overall pattern is smoothly self-replicating, except when the duplicated terminus region is released from the septum and recoils to the center of a sister nucleoid. In circular cross-section of the cell, the left and right arms of the chromosome form separate, parallel structures that lie in each cell half along the radial cell axis. In contrast, replication forks and origin and terminus regions are found mostly at the center of the cross section, balanced by the parallel chromosome arms. The structure is consistent with the model in which the nucleoid is a constrained ring polymer that develops by spontaneous thermodynamics. The ring polymer pattern extrapolates to higher growth rates and also provides a structural basis for the form of the chromosome during very slow growth.

Keywords: bacterial cell cycle; bacterial chromosome; chromosome organization; chromosome segregation; multifork replication.


Figures

Figure 1.
Figure 1.
The cell cycle and experimental approach. (A) At the slowest growth rates, the chromosome rests in B/G1 before the replication period C/S starts. This is as in eukaryotes. At faster growth rates, however, replication is continuous, and the B/G1 period disappears. The growth condition in our study is such that a new round of replication is initiated just before the previous one is terminated, as illustrated in the right panel. (B) We constructed a set of strains with two independent fluorescent chromosome markers. One type of parS sequence (pMT1 parS) was inserted at either 22′ or 98′ to serve as a reference marker, and another type of parS sequence (P1 parS) was inserted at one of the 13 positions on the map. Each strain has a pair of parS sequences and a matching pair of ParB proteins fused to CFP and YFP (CFP-P1DOParB and yGFP-pMT1D23ParB). (C) Cell size distributions of a population of cells growing under steady-state growth conditions in this study (the color of the lines matches the chromosome marker in B). Typically, we analyzed 104–105 cells per strain. Approximately 106 cells were studied in this work. This was sufficient to obtain reproducible actual cell size distributions from each strain. Both the tails of the distributions and the Gaussian-looking dividing cell size distributions indicate significant intrinsic stochasticity of growth and cell cycle regulation. The black dashed line is the theoretical distribution in the absence of cell-to-cell variation. The inset graph also illustrates the stochasticity of the cell cycle. There is a considerable variation in the length of dividing cells, defined in the measurement program as cells with a central constriction with <90% of the average cell diameter of the rest of the cell. (D) A typical field of view of one of the strains (22′ and 54.2′ markers) grown under overlapping cell cycle condition is shown. Due to multifork replication, many cells contain multiple fluorescent foci per locus.
Figure 2.
Figure 2.
Cell long axis histograms show outward information flow during multifork replication. (A) The histograms are grouped based on the number of foci of the locus and the age of the cell (throughout this study, the color of the lines matches the chromosome marker in Fig. 1B). The area below each distribution reflects the fraction of the group of cells within the population. Notice that the terminus is localized at the cell center until it splits into two, except in some new cells (e.g., age 0.0–0.2). Peaks of other distributions also split into two after replication and drift away from each other (indicated by arrows). The significant fraction of the three-foci cells implies significant stochasticity of initiation of replication; ∼20% (∼10 min) of the 55-min generation time (see the Materials and Methods). Except for the three-foci cells, the cells are randomly oriented, and the histograms are symmetric (see Supplemental Fig. 1 for unsorted three-foci histograms). (B) The population average of DNA distribution within the age group can be obtained by summing up the weighted histograms in A (see the Materials and Methods). (C) Schematic development of the chromosome organization during replication along the cell long axis. This summarizes the natural flow of structural development of the replicating chromosome seen in the histograms in A.
Figure 3.
Figure 3.
Replicated loci separate in three limited zones where the replication forks are active. (A) Replication forks show narrow distributions centered around either the cell center or the cell quarters. Their long axis distributions match well with the distribution of duplicated loci in the action of separation inferred by the elongated shape of the splitting foci. (B) The position and dynamics of the replication forks are likely the consequence of the spatial organization of the chromosomes rather than vice versa (see the text).
Figure 4.
Figure 4.
The terminus transition. (A) Evidence at the population level. The top panel shows the statistics of the cells with two origin foci and one terminus. In all cells, the three loci are initially in the order of ori–ori–ter and switch to ori–ter–ori. A similar transition is seen with loci spanning the large fraction of the chromosome. (B) Evidence at the single-cell level. These images show two types of fluorescent fusion proteins: the extended red regions for the nucleoid labeled by HU-mCherry and the green foci for 33.7′ (terminus), marked by GFP-ParB. The same mother cell is outlined in the same color across the time images. The time-lapse images were taken every 6 min and lasted for no more than two cell generations to prevent slowing cell growth. The following sequence of events is evident from the time-lapse movies: the localization of terminus at the cell center, the split of the duplicated terminus foci, and the asynchronous recoil of each terminus region focus to the center of each sister nucleoid.
Figure 5.
Figure 5.
The left and right arms of the chromosome form parallel structures and occupy each cell half along the cell radial axis. (A) The cell radial axis histograms. The left and right arms of the circular chromosome show characteristic two-peak distributions, implying that they are closer to the inner cell wall membrane. In contrast, the ori and ter regions show single-peak distributions. The radial distributions are constant with respect to the cell age, except for the ter locus. The ter distribution is bimodal for young cells (age group 0.0–0.2). The distribution gradually becomes single-peaked as the age of the cell increases. Because the terminus is localized at the cell center (Fig. 2A), the simplest interpretation is that the terminus region moves toward the central cell axis as constriction progresses. These results can be explained by a ring polymer model of the chromosome (see the text). (B) Examples of single-peak (space-filling and floating nucleoids) and bimodal (near membrane and separated arms) distributions. Orange represents the left chromosome arm, and green represents the right arm (colors match the illustration in A). Due to rotational symmetry of the cylindrical cross-section of E. coli, histograms compiled from a population of cells can be explained by several different models and require further analysis, as in C. (C) The radial axis positions of two genetic loci plotted against each other. Loci on the same arm are likely to be found in the same cell half, whereas loci on the opposite arms are likely found on the opposite cell halves. This supports the separated arms model in B. (D) The average DNA mass distribution along the cell radial axis as inferred by summing the weighted positional histograms (e.g., in A) in each age group. The radial axis distributions are constant, independent of the age group, except for ter.
Figure 6.
Figure 6.
The ring polymer model of the bacterial chromosome. (A) The arms of the polymer can be interpreted as two imaginary tubes confined in each half along the radial axis. The tubes meet at the ori region and result in a single-peak distribution, as depicted in the floating model in Figure 5B. Similar principles apply to more complex topologies. For instance, replication forks can be considered as a three-way junction, and the terminus can be considered as a four-way junction. Their radial axis histograms show a single peak. In contrast, loci in the separated arms show double peaks (Supplemental Fig. 3). (B) A ring polymer in narrow versus wide cylindrical containers. The diameter of E. coli varies in response to changes in growth rate (<600–700 nm in slow-growing conditions and >800–900 nm in faster-growing conditions) (Trueba and Woldringh 1980). The principles illustrated in A are valid when the cylinder is sufficiently wide to accommodate two imaginary tubes (diameter 440 nm) (Pelletier et al. 2012). As the cylinder becomes narrower and only one tube can fit, the global orientation of the polymer should be understood as that of a linear polymer in a cylinder (Jun and Wright 2010). This can explain the conformation of the E. coli chromosome in all growth conditions and the major difference of the chromosome conformation between slow- and fast-growing cells seen in the data.
Figure 7.
Figure 7.
Illustration of spatiotemporal development of the chromosome during overlapping cell cycles using the ring polymer model. The conventional replication diagrams at right are color-coded progressively from origin (purple circles) to terminus (green and marked with a black triangle). We illustrate five critical stages in the cell cycle based on the cell age groups. At left are the corresponding long axis positions, as seen in the data in Figure 2. Colored spheres represent the DNA blocks, corresponding to their replication diagrams at the right. Only the long axis information is shown and not how the DNA is packed into the circular cross-section of the cell. A full animation of the figure is given in Supplemental Movie S2.

References

    1. Adachi S, Kohiyama M, Onogi T, Hiraga S 2005. Localization of replication forks in wild-type and mukB mutant cells of Escherichia coli. Mol Genet Genomics 274: 264–271 - PubMed
    1. Adachi S, Fukushima T, Hiraga S 2008. Dynamic events of sister chromosomes in the cell cycle of Escherichia coli. Genes Cells 13: 181–197 - PubMed
    1. Bakshi S, Siryaporn A, Goulian M, Weisshaar JC 2012. Superresolution imaging of ribosomes and RNA polymerase in live Escherichia coli cells. Mol Microbiol 85: 21–38 - PMC - PubMed
    1. Bates D, Kleckner N 2005. Chromosome and replisome dynamics in E. coli: Loss of sister cohesion triggers global chromosome movement and mediates chromosome segregation. Cell 121: 899–911 - PMC - PubMed
    1. Bigot S, Sivanathan V, Possoz C, Barre FX, Cornet F 2007. FtsK, a literate chromosome segregation machine. Mol Microbiol 64: 1434–1441 - PubMed

Publication types

MeSH terms