. 2014 Apr;75(4):508-24.
doi: 10.1002/ana.24100. Epub 2014 Mar 13.

Prenatal cerebral ischemia triggers dysmaturation of caudate projection neurons

Affiliations

Prenatal cerebral ischemia triggers dysmaturation of caudate projection neurons

Evelyn McClendon et al. Ann Neurol. 2014 Apr.

Abstract

Objective: Recently, we reported that the neocortex displays impaired growth after transient cerebral hypoxia-ischemia (HI) at preterm gestation that is unrelated to neuronal death but is associated with decreased dendritic arbor complexity of cortical projection neurons. We hypothesized that these morphological changes constituted part of a more widespread neuronal dysmaturation response to HI in the caudate nucleus (CN), which contributes to motor and cognitive disability in preterm survivors.

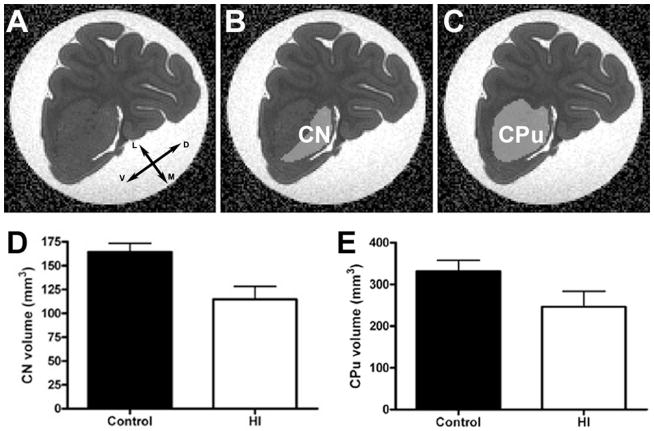
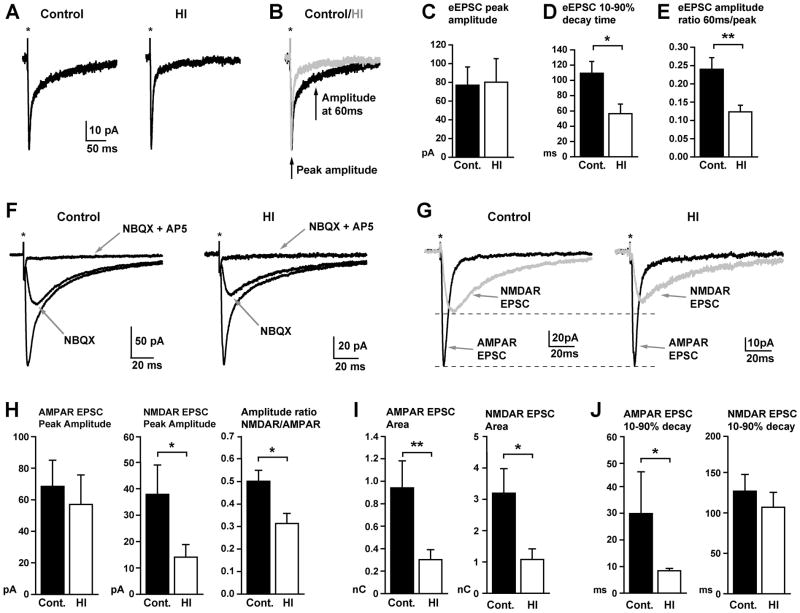
Methods: Ex vivo magnetic resonance imaging (MRI), immunohistochemistry, and Golgi staining defined CN growth, cell death, proliferation, and dendritic maturation in preterm fetal sheep 4 weeks after HI. Patch-clamp recording was used to analyze glutamatergic synaptic currents in CN neurons.

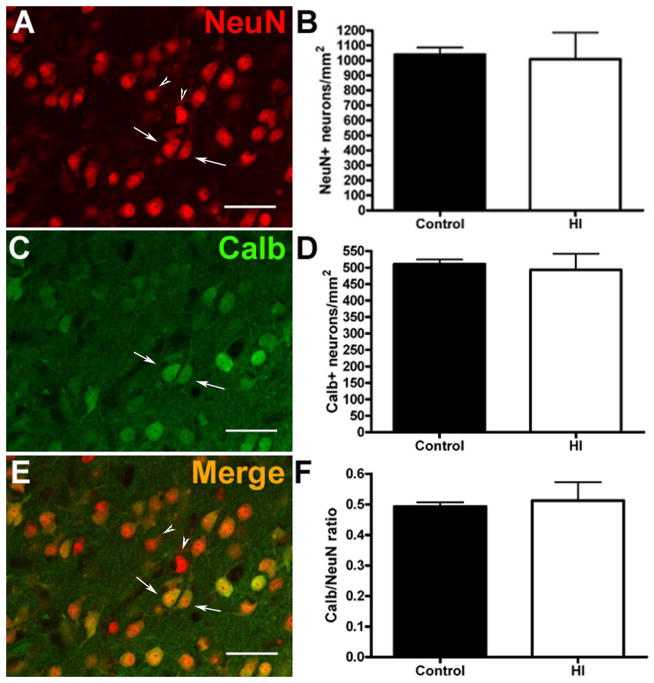
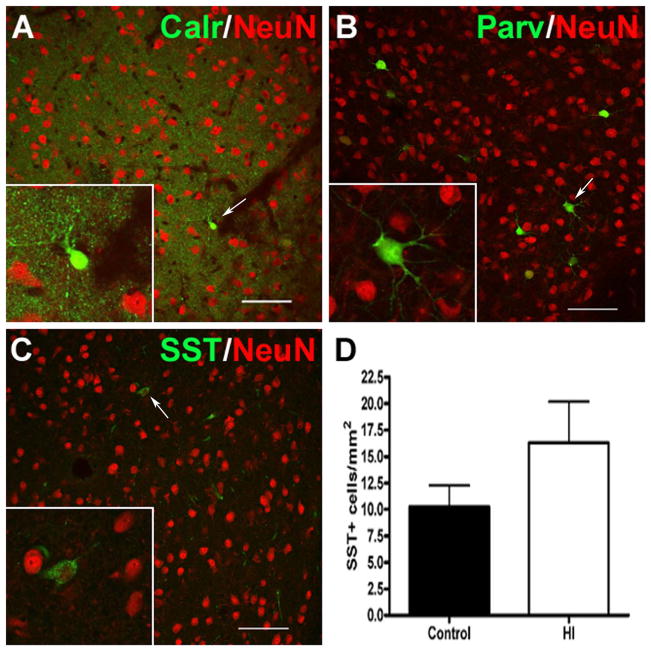
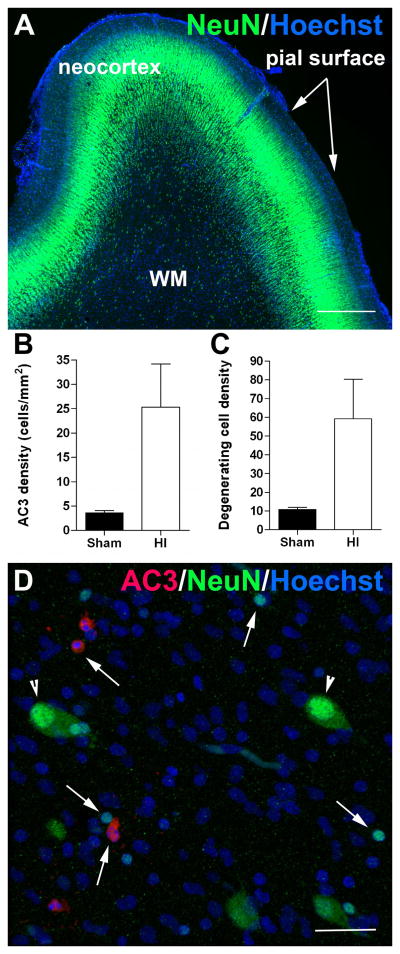
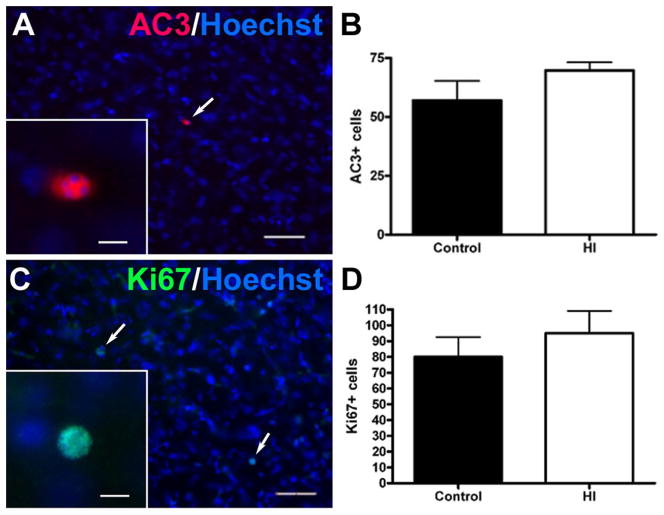
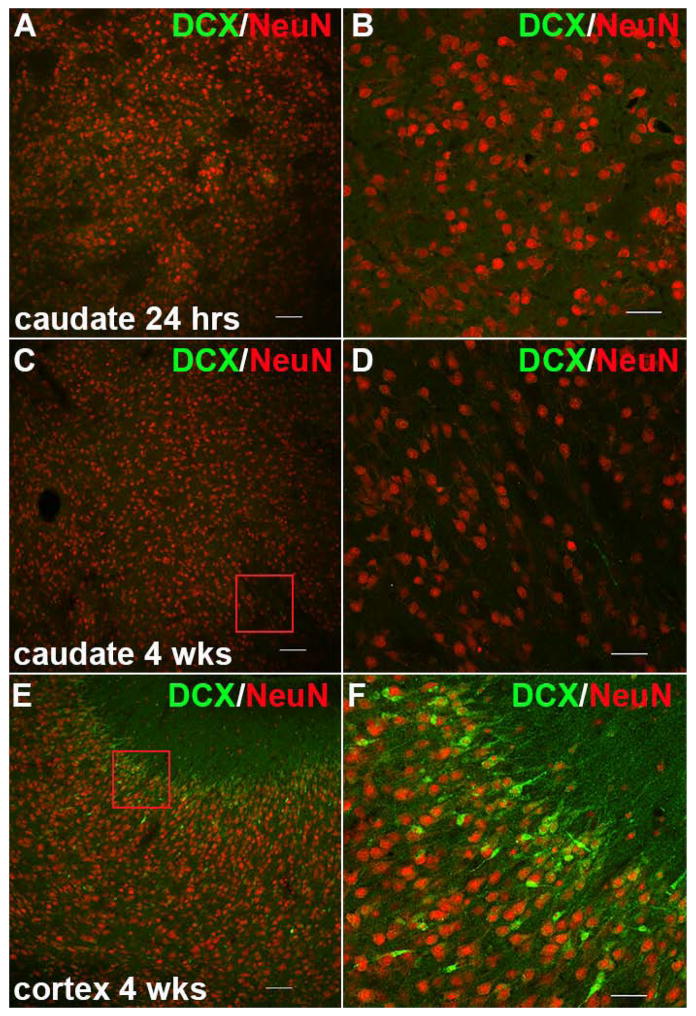
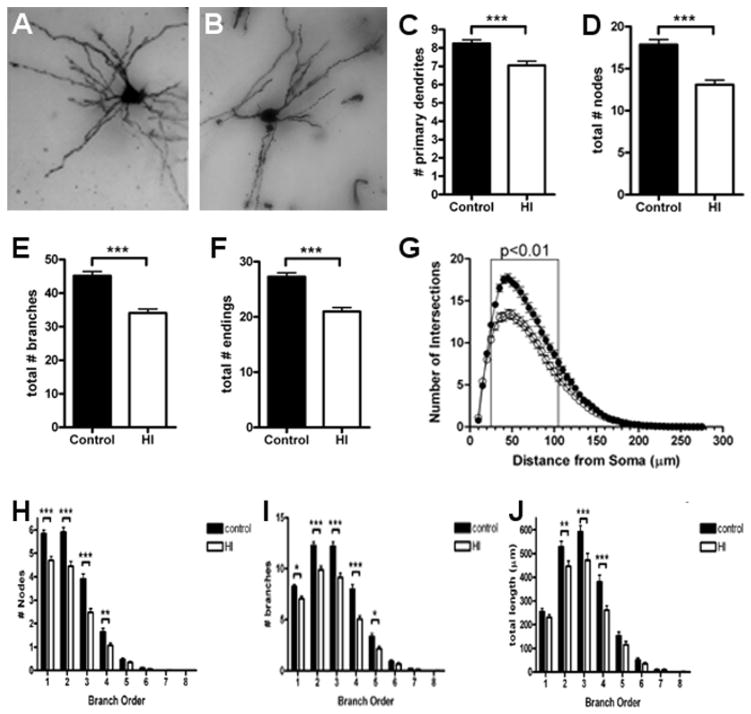
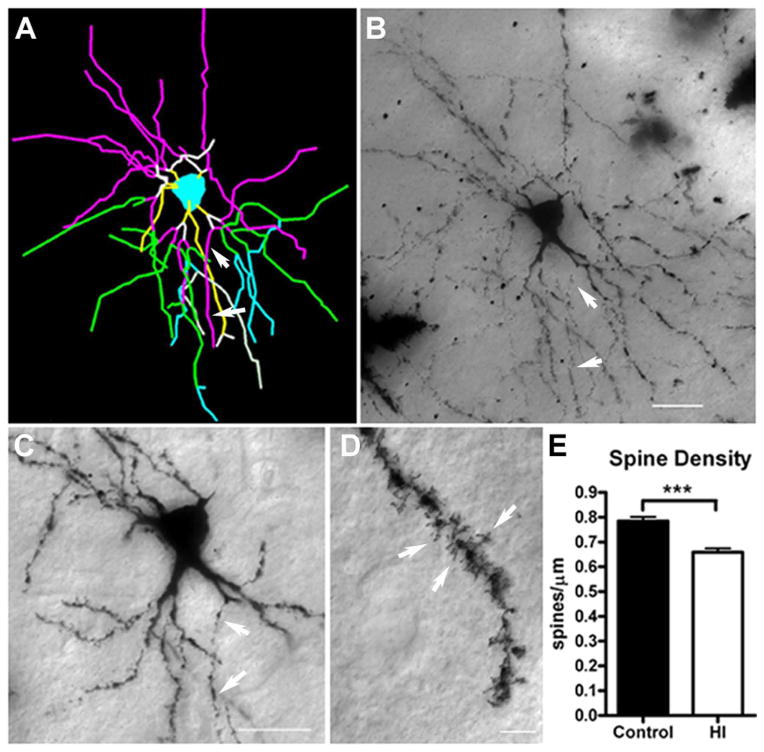
Results: MRI-defined growth of the CN was reduced after ischemia compared to controls. However, no significant acute or delayed neuronal death was seen in the CN or white matter. Nor was there significant loss of calbindin-positive medium spiny projection neurons (MSNs) or CN interneurons expressing somatostatin, calretinin, parvalbumin, or tyrosine hydroxylase. Morphologically, ischemic MSNs showed a markedly immature dendritic arbor, with fewer dendritic branches, nodes, endings, and spines. The magnitude and kinetics of synaptic currents, and the relative contribution of glutamate receptor subtypes in the CN were significantly altered.

Interpretation: The marked MSN dendritic and functional abnormalities after preterm cerebral HI, despite the marked resistance of immature CN neurons to cell death, are consistent with widespread susceptibility of projection neurons to HI-induced dysmaturation. These global disturbances in dendritic maturation and glutamatergic synaptic transmission suggest a new mechanism for long-term motor and behavioral disabilities in preterm survivors via widespread disruption of neuronal connectivity.


Conflict of interest statement

Potential Conflicts of Interest

Nothing to report.

Figures

Figure 1
Figure 1
MRI-defined volumetric changes in the head of the caudate nucleus (CN). (AC) The MRI DWI images were loaded as grayscale images into ITK Snap with FA overlays (A) to serve as a template for the creation of masks (B & C) to measure the volume of the CN (B) and caudoputamen (CPu) complex (C). (D) The CN in the hypoxic/ischemic (HI) group (white bars), four weeks post-insult, is significantly reduced vs. control animals (black bars); p = 0.024. (E) A similar near-significant trend was observed in the CPu; p = 0.11). Coordinates arrows in A designate dorsal (D), ventral (V), medial (M), and lateral (L).
Figure 2
Figure 2
Volumetric differences in the ischemic CN were not associated with neuronal loss. No significant differences were observed in total neuronal density (A–B), visualized by NeuN immunoreactivity (red channel); p = 0.89 or in the density of MSNs (C–D), visualized by calbindin (Calb) immunoreactivity (green channel); p = 0.78. Arrows indicate examples of cells labeled for NeuN and calbindin and arrowheads indicate cells labeled only for NeuN. (E–F) There were no significant differences in the ratio of calbindin/NeuN in controls vs. the HI group (red-green merge); p = 0.80. Scale bars in A, C, E = 50 μm.
Figure 3
Figure 3
GABAergic interneuron populations within the CN were sparse as visualized by immunostaining for (A) calretinin (Calr; green), (B) parvalbumin (Parv; green) and (C) somatostatin (SST; green). White arrows indicate the cell shown in each inset. Total neurons were visualized by staining for NeuN (red; A–C). (D) No significant differences in SST density were observed between controls (black bar) and the HI group (white bar); p = 0.22. Images in A–C (20X) represent the highest density region observed for each interneuron marker. Scale bars in A, C, E = 50 μm.
Figure 4
Figure 4
Neurons in the white matter are resistant to cell death. (A) NeuN-positive neurons (green cells) are abundant throughout the neocortex and white matter (WM) at 0.65 gestational age (GA). (B–C) The density of degenerating cells that labeled for activated caspase-3 (AC3) (B) and Hoechst (C) in the white matter were significantly increased at 24 h after HI at 0.65 GA. (D) Representative photomicrograph of degenerating cells in the white matter at 24h after HI that labeled for AC3 (red cells; arrows) and Hoechst (blue condensed nuclei; arrows). Note the presence of many normal-appearing NeuN-positive neurons (green cells; arrowheads), which showed no evidence of injury. Scale bars A = 500 μm, D = 30 μm. *p<0.005.
Figure 5
Figure 5
Reduced growth of the ischemic CN was not associated with enhanced delayed cell death or proliferation at 4 weeks after HI. (A) Typical low density of apoptotic cells (white arrow; inset shows higher power detail), double-labeled with Hoechst (blue) and anti-caspase 3 (AC3; red) antibody. (B) There were no significant differences in the magnitude of apoptosis between the control and HI groups defined by quantification of AC3 labeling in the entire CPu; p = 0.20. (C) Typical low density of proliferating cells (white arrows; higher power detail in the inset), double-labeled with Hoechst (blue) and anti-Ki67 antibody (see inset). (D) No differences in cell proliferation were detected between the two groups, as defined by quantification of Ki67 in the entire CPu; p = 0.45. Scale bars in A and C = 100 μm; insets = 15 μm.
Figure 6
Figure 6
Recently generated neurons were not visualized in the CN during the acute or chronic phases after HI. (A) Doublecortin (DCX, green) and NeuN (red) staining in the CN 24 hours after HI. (B) A higher magnification image of panel A, which shows that no DCX-positive cells are present. (C) Staining for DCX (green) and NeuN (red) in the CN 4 weeks after HI. (D) A higher magnification image of the red box in panel C, which shows that no DCX-positive cells are present. (E) DCX (green) and NeuN (red) staining in the cerebral cortex. DCX-positive cells were abundant in the superficial layers of the cortical mantle. Panel F is a higher magnification image of the red box in panel E. Scale bars in A, C, and E = 100 μm; scale bars in B, D and F = 50 μm.
Figure 7
Figure 7
Abnormal development of the dendritic arbor was seen in MSNs in the CN at 4 weeks after HI. (A) An example of Golgi-stained MSNs is shown for the control (A) and HI groups (B). (C to F) Total number of primary dendritic branches (C), total number of nodes (D), total number of branches (E), and total dendritic endings (F) in the control (black bars) and HI (white bars) groups. (G) Sholl analysis of the number of basal dendritic intersections in control (closed circles) and HI (open circles) groups. (H to J) Branch order analysis of the total number of dendritic nodes (H), total number of dendritic branches (I), total dendritic length (J) in control (black bars) and HI (white bars) groups. n = 121 control and n= 124 HI group cells. Data are means ± SEM. *P < 0.05, **P < 0.01, ***P < 0.001.
Figure 8
Figure 8
Impaired dendritic arbor maturation is accompanied by reduced dendritic spine density. For the same population of medium spiny neurons (MSNs) that were sampled for dendritic morphology, spine density was quantified on third-order terminal dendritic branches, which were commonly identified for both groups of neurons. (A–C) Example of third-order terminal branches (white arrows) that were present on the Neurolucida tracing (panel A; purple lines) and the corresponding Golgi-impregnated neuron (B and C). In (A), the yellow, white, purple, green, and blue lines represent first, second, third, fourth, and fifth order branches, respectively. (D) Dendritic spines (white arrows) visualized on a Golgi-impregnated MSN. (E) Spine density in control and HI groups at 4 weeks of recovery. Preterm neurons in the HI group (white bars) had a significant reduction in spines of ~12% vs. controls (black bars); N=108, control and N=99, HI group; p<0.001). Scale bars in B, C = 25 μm and in D = 5 μm.
Figure 9
Figure 9
HI reduces the magnitude, time course and relative receptor makeup of glutamatergic excitatory synaptic currents in caudate nucleus neurons. (A) Representative electrically evoked excitatory postsynaptic currents (eEPSCs) in voltage-clamped (Vh = −30mV) caudate nuclear neurons from control (left) and HI animals (right). Note, to isolate excitatory currents, all recordings were made in the continued presence of the GABAA receptor antagonist, GABAzine (10μM). (B) Traces from (A) are overlaid in (B) to illustrate faster decay time of eEPSCs in HI cells (gray trace) relative to similar amplitude eEPSCs in control cells (black trace). (C–E) Plots of the mean peak amplitude (C), 10–90% decay time (D), and ratio of amplitudes at late (60ms) and early (peak) time points (E) of eEPSCs in control (black) and HI (white) cells. The peak amplitude of eEPSCs was not significantly different (p=0.84), but the 10–90% decay time was significantly reduced in HI cells (p=0.03), resulting in a significantly reduced amplitude ratio when comparing the amplitude at 60ms and at the peak (p=0.004, n = 9 control and 12 HI cells from 3 animals each). (F) Traces show representative eEPSCs in control (left) and HI (right) neurons, and response to bath application of the AMPA/Kainate receptor antagonist, NBQX (25μM) alone, and then combined with the NMDA receptor antagonist, AP5 (50μM), both indicated by gray arrows. (G) Digital subtraction of traces from (F) reveal the AMPA receptor (black) and NMDA receptor (gray) components of the eEPSC in control (left) and HI (right) neurons. Dashed lines illustrate that when the eEPSCs are scaled to the peak of the AMPA receptor component, the amplitude of the corresponding NMDA receptor component is smaller in HI neurons. (H) Plots of the peak amplitude of the AMPA (left) and NMDA (middle) receptor components, and the corresponding amplitude ratio (right, calculated for the two components in each individual cell) of the eEPSC in control (black) and HI (white) neurons. There were no differences in the amplitude of the AMPA receptor component (p=0.34), but a significantly reduced NMDA receptor component (p=0.04), and correspondingly, the ratio of the NMDA to AMPA component amplitudes (p=0.02) in HI neurons. (I) Plots showing that the area of both the AMPA and the NMDA receptor components of the eEPSC are significantly reduced in HI neurons (p=0.008 and 0.01, respectively). (J) Plots showing that the 10–90% decay time of the AMPA receptor component is significantly faster in HI neurons (p=0.03), but the decay time of the NMDA receptor component is not significantly different between control and HI cells (p= 0.48). All plots in H to I are from analysis of pharmacologically isolated AMPA and NMDA receptor components of the eEPSC (as shown in F&G) from 8 control and 12 HI cells from 3 animals each. Statistical comparisons were made with a Student’s t-test (E, H middle and right plots, I, J right plot) or a Mann Whitney Rank Sum test (C, D, H left plot, J left plot), depending on whether the values were normally distributed.

References

    1. Allen M. Outcomes after brain injury in the preterm infant. In: Miller S, Shevell M, editors. Acquired Brain Injury in the Fetus and Newborn. London: Mac Keith Press; 2012. pp. 99–120.
    1. Volpe JJ. Brain injury in premature infants: a complex amalgam of destructive and developmental disturbances. Lancet Neurol. 2009;8:110–24. - PMC - PubMed
    1. Keunen K, Kersbergen KJ, Groenendaal F, Isgum I, de Vries LS, Benders MJ. Brain tissue volumes in preterm infants: prematurity, perinatal risk factors and neurodevelopmental outcome: a systematic review. J Matern Fetal Neonatal Med. 2012;25 (Suppl 1):89–100. - PubMed
    1. Andiman SE, Haynes RL, Trachtenberg FL, et al. The cerebral cortex overlying periventricular leukomalacia: analysis of pyramidal neurons. Brain Pathol. 2010;20:803–14. - PMC - PubMed
    1. Kinney H, Haynes R, Xu G, et al. Neuron deficit in the white matter and subplate in periventricular leukomalacia. Ann Neurol. 2012;71:397–406. - PMC - PubMed

Publication types

MeSH terms