. 2014 Jan 13;211(1):89-104.
doi: 10.1084/jem.20130301. Epub 2014 Jan 6.

Pro-inflammatory human Th17 cells selectively express P-glycoprotein and are refractory to glucocorticoids

Affiliations

Pro-inflammatory human Th17 cells selectively express P-glycoprotein and are refractory to glucocorticoids

Radha Ramesh et al. J Exp Med. .

Abstract

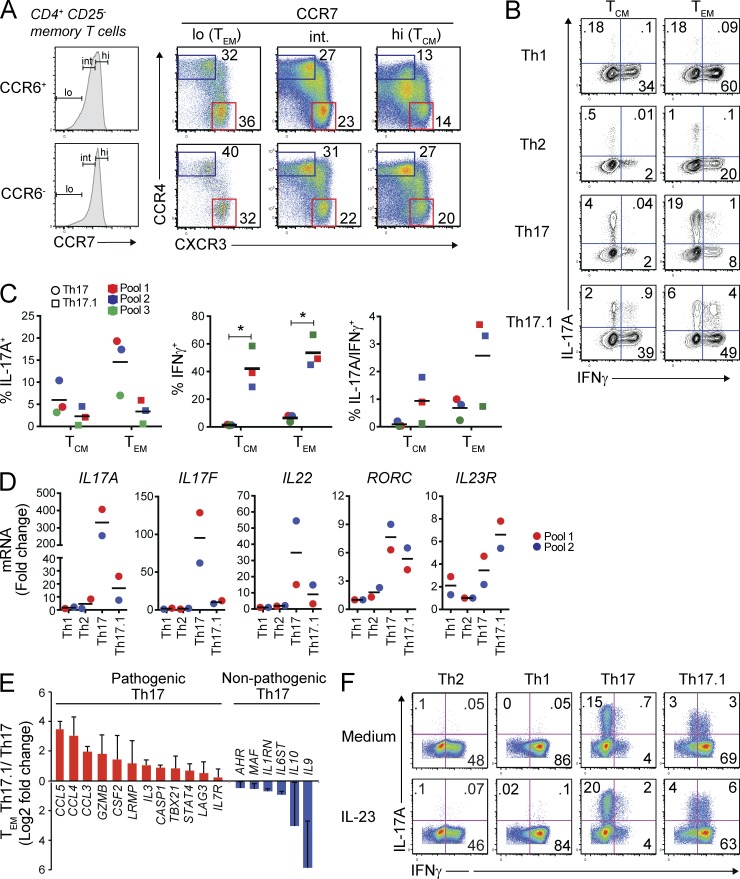
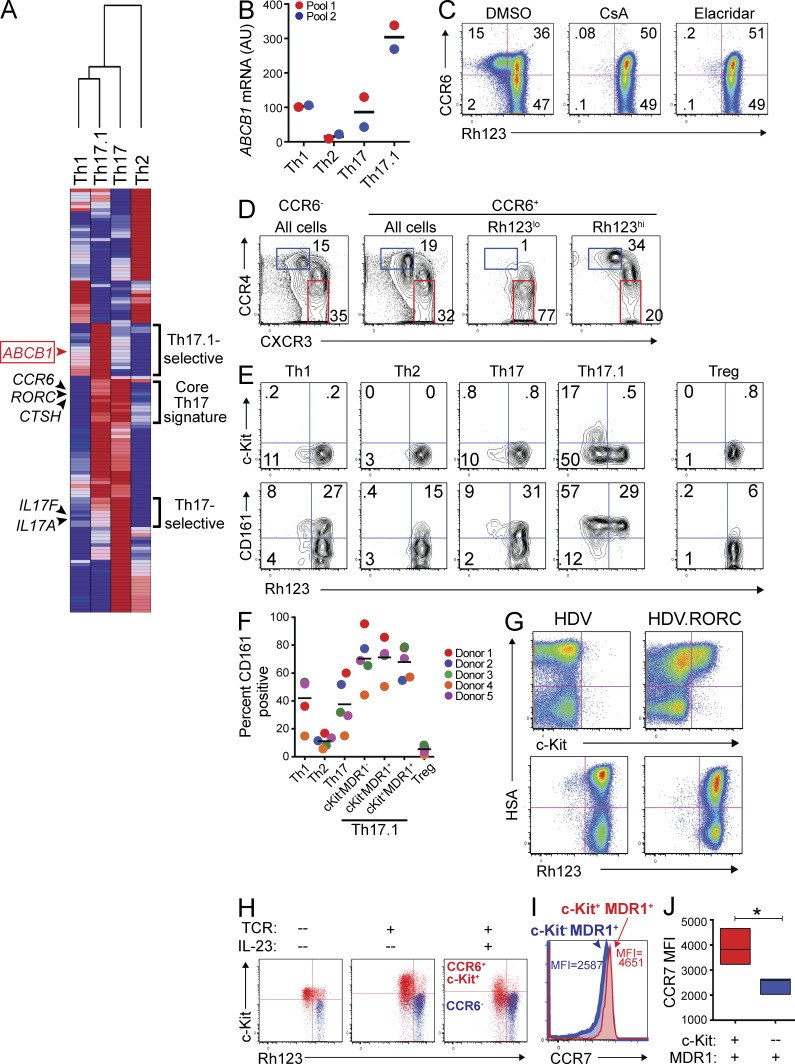
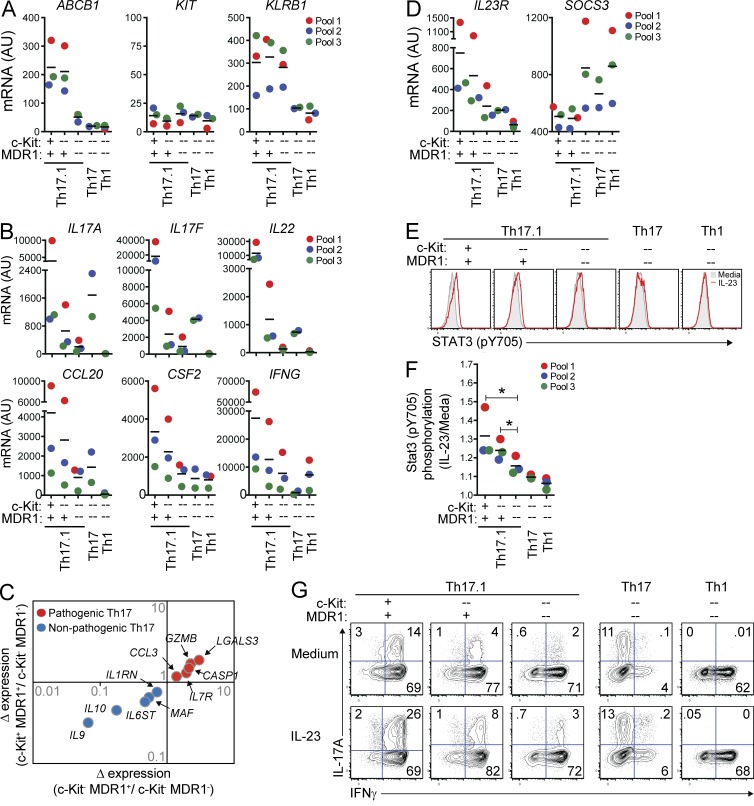
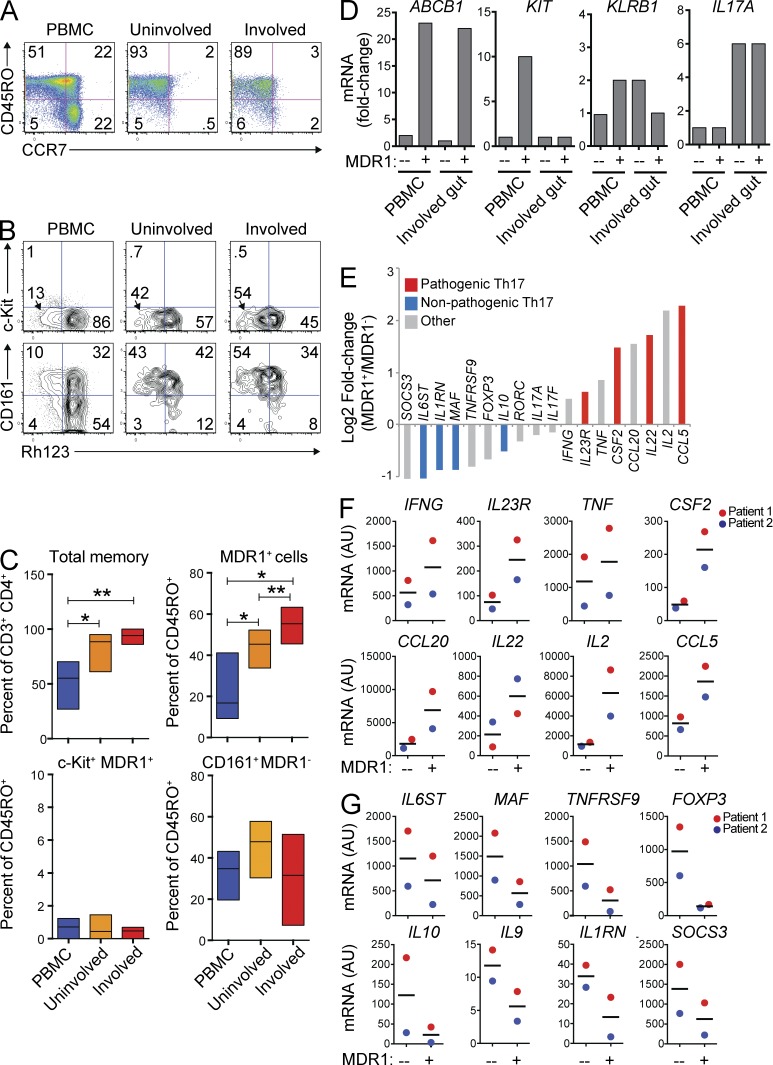
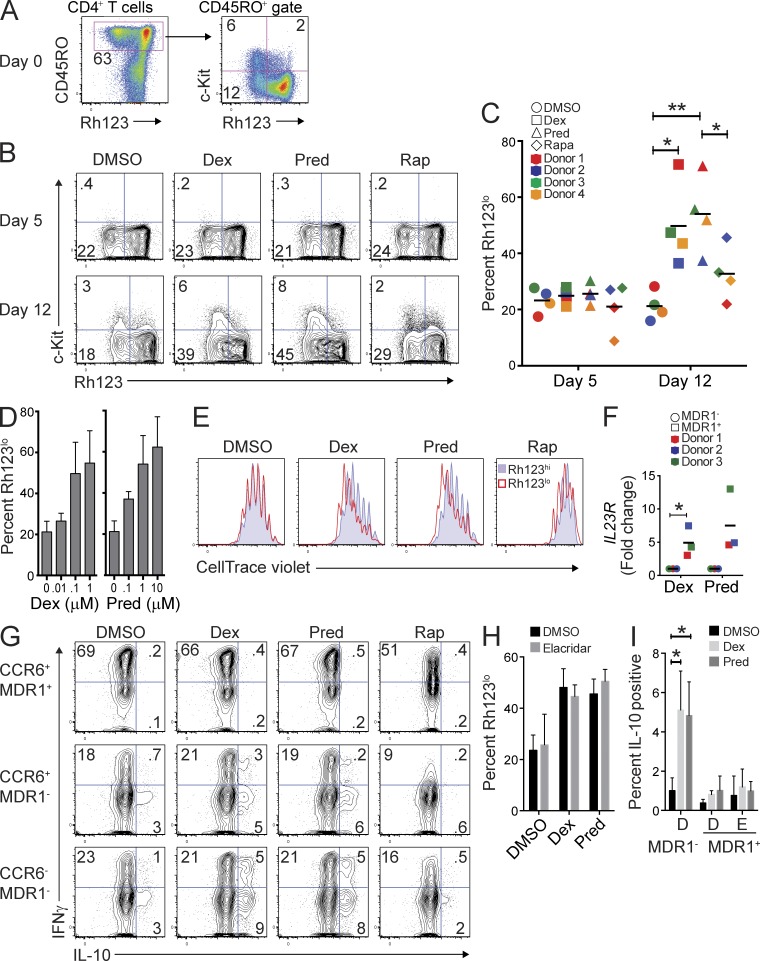
IL-17A-expressing CD4(+) T cells (Th17 cells) are generally regarded as key effectors of autoimmune inflammation. However, not all Th17 cells are pro-inflammatory. Pathogenic Th17 cells that induce autoimmunity in mice are distinguished from nonpathogenic Th17 cells by a unique transcriptional signature, including high Il23r expression, and these cells require Il23r for their inflammatory function. In contrast, defining features of human pro-inflammatory Th17 cells are unknown. We show that pro-inflammatory human Th17 cells are restricted to a subset of CCR6(+)CXCR3(hi)CCR4(lo)CCR10(-)CD161(+) cells that transiently express c-Kit and stably express P-glycoprotein (P-gp)/multi-drug resistance type 1 (MDR1). In contrast to MDR1(-) Th1 or Th17 cells, MDR1(+) Th17 cells produce both Th17 (IL-17A, IL-17F, and IL-22) and Th1 (IFN-γ) cytokines upon TCR stimulation and do not express IL-10 or other anti-inflammatory molecules. These cells also display a transcriptional signature akin to pathogenic mouse Th17 cells and show heightened functional responses to IL-23 stimulation. In vivo, MDR1(+) Th17 cells are enriched and activated in the gut of Crohn's disease patients. Furthermore, MDR1(+) Th17 cells are refractory to several glucocorticoids used to treat clinical autoimmune disease. Thus, MDR1(+) Th17 cells may be important mediators of chronic inflammation, particularly in clinical settings of steroid resistant inflammatory disease.


Figures

Figure 1.
Figure 1.
Th17 cytokines and IL23R are independently regulated in human T cell subsets. (A) CD4+CD25 memory (CD45RO+) T cell subsets from healthy adult donor peripheral blood were analyzed by flow cytometry. CCR6+ or CCR6 cells were gated as CCR7hi (central memory; TCM), CCR7int (CCR7-intermediate), or CCR7lo (effector memory; TEM) cells, and CCR4 and CXCR3 expression was analyzed. Data represent >20 stains performed on individual donors or donor pools. (B) FACS-sorted TCM (CCR7hi) or TEM (CCR7lo) subsets were stimulated with PMA and ionomycin (P + I) and production of IFN-γ and IL-17A was determined by intracellular cytokine staining. Th1, CCR6CCR4loCXCR3hi; Th2, CCR6CCR4hiCXCR3lo; Th17, CCR6+CCR4hiCXCR3lo; Th17.1, CCR6+CCR4loCXCR3hi. Representative flow cytometry plots from 3 experiments performed on different pools of healthy adult donor blood are shown, and each donor pool contained blood from 2–4 individual donors. (C) IFN-γ and IL-17A production by FACS-sorted TCM or TEM cells was determined by intracellular cytokine staining as in B on 3 different pools of healthy adult donor peripheral blood. Each donor pool contained blood from 2–4 different donors. Individual and mean percentages of IL-17A+ (left), IFN-γ+ (middle), or IL-17A+/IFN-γ+ (right) T cells are shown, and data from each donor pool is color-coded. *, P < 0.05 by paired Student’s t test. (D) TEM Th1, Th2, Th17, or Th17.1 subsets were FACS-sorted as in B from two different pools of healthy donor peripheral blood. Both donor pools contained blood from 2–4 individual donors. Sorted cells were stimulated with anti-CD3/anti-CD28 for 72 h and expression of the indicated genes was measured by nanostring. Data are shown as fold change in gene expression within each donor pool; data from the two donor pools are color-coded. Horizontal bars in C and D represent the mean values. (E) Expression of pathogenic (red) or nonpathogenic (blue) murine Th17-signature genes (Lee et al., 2012) was determined in TEM Th17 and Th17.1 cells by nanostring as in D. Data are shown as mean relative (Log2 fold change) mRNA expression ± SD from 2 experiments on cells from different pools of healthy adult donor blood as in D. (F) TEM Th1, Th2, Th17, or Th17.1 cells (FACS-sorted as in B) were stimulated with anti-CD3/anti-CD28 and cultured for 6 d with or without IL-23. Cells were then restimulated with PMA and ionomycin and IFN-γ and IL-17A expression was determined by intracellular cytokine staining and FACS analysis. Data represent 3 experiments performed on independent donor pools, with each pool containing blood from 2–4 individual donors.
Figure 2.
Figure 2.
A novel subset of human Th17.1 cells is characterized by transient c-Kit and stable MDR1 expression. (A) TEM Th1, Th2, Th17, or Th17.1 cells were FACS-sorted from healthy adult donor peripheral blood as in Fig. 1 B. Sorted cells were stimulated with anti-CD3/anti-CD28 for 36 h and RNA was isolated for microarray analysis. Mean normalized raw gene expression values from two independent microarray experiments on cells sorted from different donor pools (each pool containing blood from 3–4 donors) were used to identify differentially expressed genes (1.8-fold cutoff). Data shown is a hierarchical clustering heatmap of all differentially expressed genes, with log2 transformation and row normalization. Red, high relative gene expression; dark blue, low relative gene expression. Representative gene symbols within each cluster are shown (a complete list of the genes and their absolute expression values within each cluster is provided in Table S1). (B) TEM Th1, Th2, Th17, or Th17.1 cells, FACS-sorted as in Fig. 1 B, were stimulated with anti-CD3/anti-CD28 for 72 h and expression of ABCB1 was determined by nanostring. Data are shown as ABCB1 mRNA expression (AU, arbitrary units) in two experiments performed on independent (color-coded) donor pools, with each pool containing blood from 2–4 individual donors. Horizontal bars represent the mean values. (C) Total CD4+CD25CD45RO+ memory T cells isolated from healthy adult donor peripheral blood were labeled with rhodamine 123 (Rh123). After a 1-h efflux period at 37°C in the presence of vehicle (DMSO) or MDR1 inhibitors (CsA, cyclosporine A; Elacridar, selective MDR1 inhibitor), cells were stained with antibodies against CCR6, and Rh123 efflux and CCR6 expression was analyzed by FACS. Data shown are FACS plots from one experiment performed on cells from a healthy adult donor, and represent 3–4 independent experiments performed on cells isolated from different donors. (D) Rh123 efflux by CD4+ memory T cells was determined by FACS analysis as in C. After Rh123 efflux, cells were stained with antibodies against CCR6, CCR4, and CXCR3, and CCR4 and CXCR3 expression was analyzed on total CCR6 or CCR6+ cells, or on CCR6+ cells gated as Rh123lo (MDR1+) or Rh123hi (MDR1). Data shown are representative FACS plots of >10 experiments performed on memory T cells isolated from independent donors. (E) CD4+ memory T cells were labeled with Rh123 and analyzed for Rh123 efflux as in C. After Rh123 efflux, cells were stained with antibodies against CD25, CCR6, CCR4, CXCR3, CCR7, c-Kit (CD117), and CD161. Cells were gated as TEM (CCR7lo) Th1 (CD25CCR6CCR4loCXCR3hi), Th2 (CD25CCR6CCR4hiCXCR3lo), Th17 (CD25CCR6+CCR4hiCXCR3lo), Th17.1 (CD25CCR6+CCR4loCXCR3hi), or T reg (CD25hi), and Rh123 efflux versus c-Kit (CD117; top) or CD161 (bottom) expression was analyzed in each subset. The FACS plots shown are representative of 5 independent experiments performed on memory T cells isolated from different donors. (F) The percentage of CD161+ cells within human TEM Th1, Th2, Th17, Th17.1 subsets and T reg cells was determined by FACS analysis as in E. Th17.1 cells were further gated into 3 subsets based on c-Kit expression and Rh123 efflux: c-KitMDR1/Rh123hi, c-KitMDR1+/Rh123lo, and c-Kit+MDR1+/Rh123lo. Individual and mean percentages of CD161+ cells within each subset ± SD from 5 independent experiments performed on memory T cells isolated from individual (color-coded) donors is shown. (G) Naive CD4+ T cells were isolated from healthy adult donor peripheral blood, stimulated with anti-CD3/anti-CD28, and transduced with empty- (HDV) or RORC-containing (HDV.RORC) lentiviral particles that also contain a mouse HSA (heat stable antigen; a.k.a. CD24) expression cassette. Transduced T cells were expanded in IL-2–containing media for 7 d, and were then loaded with Rh123, incubated at 37°C for 1 h to allow for Rh123 efflux, and stained with antibodies against c-Kit or mouse HSA; Rh123 efflux and c-Kit expression was analyzed as a function of HSA expression in transduced T cells by FACS. FACS plots shown are representative of 3 independent experiments performed on naive T cells isolated from different donors. (H) CD4+ memory T cells isolated from healthy adult peripheral blood were FACS-sorted into CD25CCR6+c-Kit+ (red) or CCR6 (blue) subsets. Cells were either left resting (no TCR), or were stimulated with anti-CD3/anti-CD28 and cultured for 6 d with or without IL-23. On day 6, cells were loaded with Rh123, stained with antibodies against c-Kit after Rh123 efflux, and analyzed by FACS. FACS plots shown are representative of 3 experiments using cells sorted from different donor pools, with each pool containing blood from 2–4 individual donors. (I) CD4+ memory T cells isolated from healthy adult peripheral blood were analyzed for Rh123 efflux as in E. CCR7 expression was assessed on c-Kit+ (red histogram) and c-Kit (blue histogram) MDR1+/Rh123loCD25CCR6+CCR4loCXCR3hi Th17.1 cells by FACS. The overlaid FACS histogram represents 4 experiments performed on memory T cells isolated from individual donors. CCR7 mean fluorescent intensity (MFI) is shown for c-Kit+ (red text) and c-Kit (blue text) MDR1+ Th17.1 cells. (J) CCR7 MFI in c-Kit+ (red) and c-Kit (blue) MDR1+ Th17.1 cells was determined by FACS analysis as in I. Data are shown as mean CCR7 MFI ± SD in c-Kit+ or c-Kit MDR1+ Th17.1 cells from 4 individual donors. *, P < 0.05 by paired Student’s t test.
Figure 3.
Figure 3.
Unique pro-inflammatory characteristics of human MDR1+ Th17.1 cells. (A and B) Human CD4+ memory T cells from pooled healthy adult donor peripheral blood were FACS-sorted into TEM (CCR7lo) Th17.1 (CCR6+CCR4loCXCR3hi), Th17 (CCR6+CCR4hiCXCR3lo), or Th1 (CCR6CCR4loCXCR3hi) cells. Th17.1 cells were sub-sorted into c-Kit+ or c-Kit MDR1+ (Rh123lo), or c-KitMDR1 (Rh123hi) cells as indicated; Th17 and Th1 cells were sorted as c-KitMDR1 cells (see Fig. S1 for gating/sorting strategy). All cells were stimulated with anti-CD3/anti-CD28 for 72 h and expression of ABCB1 (MDR1), KIT (c-Kit), and KLRB1 (CD161; A), or IL17A, IL17F, IL22, CCL20, CSF2 (GM-CSF), and IFNG (B) was determined by nanostring. Data are shown as individual (color-coded) and mean normalized raw expression values (AU, arbitrary units) in cells sorted from 2–3 independent donor pools, with each pool containing blood from 2–4 individual donors. (C) Expression of pathogenic (red dots) or nonpathogenic (blue dots) murine Th17-signature genes (Lee et al., 2012) in TEM c-Kit+MDR1+, c-KitMDR1+, or c-KitMDR1 Th17.1 cells was determined by nanostring as in A and B. Mean normalized raw expression values from 3 independent experiments performed on different donor pools containing blood from 2–4 individual donors were used for fold change calculations. (D) Expression of IL23R and SOCS3 mRNA was determined in human TEM subsets by nanostring as in A and B. (E) FACS-sorted TEM subsets from healthy donor peripheral blood (as in A and B) were stimulated with anti-CD3/anti-CD28 and cultured for 3 d with or without IL-23. Stat3 phosphorylation (pY705) was determined on day 3 by phospho-intracellular staining and FACS analysis. Gray filled histograms, media alone; red traced histograms, plus IL-23. Representative FACS plots are shown and represent 3 independent experiments using cells isolated from different donor pools, with each pool containing blood from 2–4 individual donors. (F) Stat3 phosphorylation was determined by flow cytometry in TEM subsets cultured with or without IL-23 for 3 d as in E. Data are shown as mean fold change in Stat3 pY705 MFI (IL-23/media alone) ± SD from 3 experiments using cells isolated from different (color-coded) donor pools. *, P < 0.05 by paired Student’s t test. (G) FACS-sorted TEM subsets from healthy donor peripheral blood were stimulated with anti-CD3/anti-CD28 and cultured for 6 d with or without IL-23. On day 6, cells were restimulated with PMA and ionomycin and IL-17A and IFN-γ expression was determined by intracellular cytokine staining and FACS analysis. FACS plots shown are representative of 3 experiments using cells sorted from different donor pools, with each pool containing blood from 2–4 individual donors. Horizontal bars represent the mean values.
Figure 4.
Figure 4.
MDR1+ Th17.1 cells are enriched and activated in clinically inflamed tissue. (A) Mononuclear cells were isolated from CD patient peripheral blood (PBMC; left), uninvolved gut (middle), or involved gut (right), and were analyzed for expression of CD45RO and CCR7. Data shown are on CD3+CD4+CD25 gated T cells and represent 5 experiments on cells from different patients. (B) Mononuclear cells from CD patient PBMC, uninvolved gut, or involved gut tissue (as in A) were loaded with Rh123, stained with antibodies against CD3, CD4, CD25, CD45RO, c-Kit, and CD161 after a 1-h Rh123 efflux period at 37°C, and analyzed by FACS. Data shown are on CD3+CD4+CD25CD45RO+ gated memory T cells. Rh123 efflux versus c-Kit (top) or CD161 (bottom) expression is shown. Data represent 3 (CD161 staining) or 4 (c-Kit staining) experiments on cells isolated from different patients. (C) Percentages of total memory (CD45RO+) cells (top left), MDR1+/Rh123lo memory cells (top right), c-Kit+MDR1+/Rh123lo memory T cells (bottom left), or CD161+MDR1+/Rh123lo memory cells (bottom right) were determined in CD patient PBMC, uninvolved gut, or involved gut tissue by FACS analysis as in B. Data are shown as mean percentages ± SD from 3–5 individual patients. *, P < 0.05; **, P < 0.01 by paired Student’s t test. (D) MDR1+ (Rh123lo) or MDR1 (Rh123hi) CD3+CD4+CD25CD45RO+ memory T cells were FACS-sorted from the PBMC of one HC donor or from mononuclear cells isolated from the involved gut of one CD patient. Sorted cells were lysed directly ex vivo, and RNA was isolated for microarray analysis. Relative (fold change) expression of ABCB1 (MDR1), KIT (c-Kit), KLRB1 (CD161), or IL17A is shown for the T cell subsets as indicated. (E) Relative ex vivo expression (Log2 fold change) of pathogenic mouse Th17-signature genes (red; Lee et al., 2012), nonpathogenic Th17-signature genes (blue; Lee et al., 2012), or other notable (gray) genes was determined by microarray analysis of MDR1+ or MDR1 memory T cells sorted from involved CD patient gut tissue as in D. (F and G) Mononuclear cells isolated from involved CD patient gut tissue were FACS-sorted into MDR1+ or MDR1 CD3+CD4+CD25CD45RO+ memory T cells, and expression of pathogenic (F) or nonpathogenic (G) mouse Th17-signature genes (Lee et al., 2012) was analyzed by nanostring. Data are shown as individual (color coded) and mean expression values (AU – arbitrary units) from 2 independent patients. Horizontal bars represent the mean values.
Figure 5.
Figure 5.
MDR1+ Th17.1 cells are refractory to glucocorticoid-mediated T cell suppression. (A) Total CD4+ T cells from healthy donor peripheral blood were labeled with Rh123, stained for CD45RO and c-Kit expression after Rh123 efflux, and analyzed for the frequency of c-Kit+ and c-Kit MDR1+ (Rh123lo) memory T cells ex vivo (day 0) by flow cytometry. FACS plots show MDR1 (Rh123 efflux) activity versus CD45RO (left) or c-Kit (right) expression. Data represent 4 experiments on individual donors. (B) Total CD4+ T cells were stimulated with anti-CD3/anti-CD28 and were cultured for 5 d (top) or 12 d (bottom) in the presence of DMSO (vehicle), dexamethasone (Dex; 0.1 µM), prednisolone (Pred; 1 µM), or rapamycin (Rap; 0.1 µM). At days 5 and 12, cells were analyzed by FACS for Rh123 efflux and c-Kit expression as in A. FACS plots shown are representative of 4 experiments on individual donors. (C) Percentage of Rh123lo (MDR1+) cells within total CD4+ T cells cultured for 5 or 12 d with DMSO, Dex, Pred, or Rap was determined by FACS analysis as in B. Data are shown as individual (color coded) and mean percentages of Rh123lo cells from 4 independent donors. *, P < 0.05; **, P < 0.01 by paired Student’s t test. Horizontal bars represent the mean values. (D) Total CD4+ T cells were stimulated with anti-CD3/anti-CD28 and treated with titrating concentrations of dexamethasone (Dex; left) or prednisolone (Pred; right). At day 12, the frequency of Rh123lo cells was determined by Rh123 efflux and FACS analysis. Data are shown as mean percentages of Rh123lo (MDR1+) T cells ± SD from 4 independent experiments performed on cells from different donors. (E) Total CD4+ T cells were labeled with CellTrace violet, stimulated with anti-CD3/anti-CD28, and treated with DMSO, Dex, Pred, or Rap as in B. On day 5, cells were further labeled with Rh123 and were analyzed for Rh123 efflux and CellTrace violet dilution by FACS analysis. Overlaid histograms show CellTrace violet dilution in T cells gated as MDR1+/Rh123lo (red histogram) or MDR1/Rh123hi (blue histogram); data represent 4 experiments performed on T cells isolated from individual donors. (F) Total CD4+ T cells were stimulated with anti-CD3/anti-CD28, treated with dexamethasone (Dex; 0.1 µM) or prednisolone (Pred; 1 µM), and cultured for 12–14 d. Cells were then loaded with Rh123, FACS-sorted into MDR1+/Rh123lo and MDR1/Rh123hi cells, and RNA was isolated to determine IL23R gene expression by qPCR. Expression of IL23R was normalized to ACTB (β-actin). Data are shown as relative (fold change) IL23R expression in MDR1+ (Rh123lo) and MDR1 (Rh123hi) T cells sorted from Dex- or Pred-treated cultures. Individual (color-coded) and mean values are shown for 3 experiments performed on cells from different donors. *, P < 0.05 by paired Student’s t test. Horizontal bars represent the mean values. (G) FACS-sorted CCR6+MDR1+/Rh123lo, CCR6+MDR1/Rh123hi, or CCR6MDR1/Rh123hi cells were stimulated with anti-CD3/anti-CD28, treated with DMSO, dexamethasone (Dex; 0.1 µM), prednisolone (Pred; 1 µM), or rapamycin (Rap; 0.1 µM), and cultured for 5 d. Cells were restimulated with PMA and ionomycin, and IFN-γ and IL-10 expression was determined by intracellular staining and flow cytometry. FACS plots are representative of 4 experiments using cells sorted from individual donors. (H) Total CD4+ T cells were stimulated with anti-CD3/anti-CD28, treated with DMSO, dexamethasone (Dex; 0.1 µM), or prednisolone (Pred; 1 µM), in the absence (DMSO) or presence of elacridar (0.1 µM). Cells were cultured for 12 d and were then analyzed for Rh123 efflux by FACS as in A, B, and D. Data are shown as percentage of MDR1+/Rh123lo T cells ± SD from 3 independent experiments using cells from different donors. (I) FACS-sorted MDR1 or MDR1+ (CCR6+) cells were stimulated with anti-CD3/anti-CD28 and cultured in the absence (DMSO) or presence of dexamethasone (Dex; 0.1 µM), or prednisolone (Pred; 1 µM) plus vehicle (DMSO; D) or 0.1 µM elacridar (E) for 5 d. Cells were restimulated with PMA and ionomycin, and IL-10 expression was determined by intracellular cytokine staining and FACS analysis. Data are shown as mean percentages of IL-10–expressing cells ± SD from 3 donors. *, P < 0.05 by paired Student’s t test.

Comment in

References

    1. Acosta-Rodriguez E.V., Rivino L., Geginat J., Jarrossay D., Gattorno M., Lanzavecchia A., Sallusto F., Napolitani G. 2007. Surface phenotype and antigenic specificity of human interleukin 17-producing T helper memory cells. Nat. Immunol. 8:639–646 10.1038/ni1467 - DOI - PubMed
    1. Afzali B., Mitchell P.J., Edozie F.C., Povoleri G.A., Dowson S.E., Demandt L., Walter G., Canavan J.B., Scotta C., Menon B., et al. 2013. CD161 expression characterizes a subpopulation of human regulatory T cells that produces IL-17 in a STAT3-dependent manner. Eur. J. Immunol. 43:2043–2054 10.1002/eji.201243296 - DOI - PMC - PubMed
    1. Ahern P.P., Schiering C., Buonocore S., McGeachy M.J., Cua D.J., Maloy K.J., Powrie F. 2010. Interleukin-23 drives intestinal inflammation through direct activity on T cells. Immunity. 33:279–288 10.1016/j.immuni.2010.08.010 - DOI - PMC - PubMed
    1. Alcorn J.F., Crowe C.R., Kolls J.K. 2010. TH17 cells in asthma and COPD. Annu. Rev. Physiol. 72:495–516 10.1146/annurev-physiol-021909-135926 - DOI - PubMed
    1. Aller S.G., Yu J., Ward A., Weng Y., Chittaboina S., Zhuo R., Harrell P.M., Trinh Y.T., Zhang Q., Urbatsch I.L., Chang G. 2009. Structure of P-glycoprotein reveals a molecular basis for poly-specific drug binding. Science. 323:1718–1722 10.1126/science.1168750 - DOI - PMC - PubMed

Publication types

MeSH terms

Substances