Review
. 2014 Jan 6;369(1636):20130035.
doi: 10.1098/rstb.2013.0035. Print 2014.

Scene perception and the visual control of travel direction in navigating wood ants

Affiliations
Review

Scene perception and the visual control of travel direction in navigating wood ants

Thomas S Collett et al. Philos Trans R Soc Lond B Biol Sci. .

Abstract

This review reflects a few of Mike Land's many and varied contributions to visual science. In it, we show for wood ants, as Mike has done for a variety of animals, including readers of this piece, what can be learnt from a detailed analysis of an animal's visually guided eye, head or body movements. In the case of wood ants, close examination of their body movements, as they follow visually guided routes, is starting to reveal how they perceive and respond to their visual world and negotiate a path within it. We describe first some of the mechanisms that underlie the visual control of their paths, emphasizing that vision is not the ant's only sense. In the second part, we discuss how remembered local shape-dependent and global shape-independent features of a visual scene may interact in guiding the ant's path.

Keywords: multi-modal directional control; phase-dependent visual control; saccades; visual learning; zigzag paths.


Figures

Figure 1.
Figure 1.
(a) Pheromone trail laid by the fire ant Solenopsis geminata, while walking over smoked glass. Dots show when ant lowered its sting and marked the glass. Dots are more frequent when reward is stronger. (b) Schematic drawing of the ant Lasius fulginosis following an artificially laid trail. (c) The zizgag paths of wood ants to a visually defined goal (+). Zigzag amplitude can range from 0.8 to 11.1 cm. (d) Details of large zigzags. Top: scale of zigzags is expanded perpendicularly to the direct path to the goal. Middle: the angle between the ant's longitudinal axis and the goal (goal angle). Bottom: the ant's translational speed. Solid vertical lines indicate the occurrence of saccade-like turns (SLTs) and dashed vertical lines goal facing just after a turn. (e) Distribution of goal angles during 30 complete 1.2 m paths. Frequency is number of frames. Inset: diagram defining goal angle. (a,b) Reproduced from [31] and [32] respectively with permission from Springer Science + Business Media. (ce) Adapted from [33].
Figure 2.
Figure 2.
Saccade-like turns on an ant's path towards a goal inset from a black–white edge. (a) Representative path from start to goal. (b) Time course of SLT shown as plots of goal angle and of rotational speed against time. Start of SLT (arrow) is defined by a sudden increase in speed and endpoint (box) by when angular speed drops to less than 50° s−1 for at least 60 ms. (c) Plot of SLT size against goal angle. (d) Plot of initial speed of SLT against goal angle. (e) Plot of the angle between the edge and the goal at the end of each SLT. Solid line shows predicted endpoints of SLTs, assuming that turns end with ants facing the goal. (a–e) Adapted from [41].
Figure 3.
Figure 3.
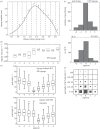
The occurrence of saccade-like turns (SLTs) within a zigzag. (a) Typical zigzag simulated from the changing values of goal angles and of angular velocities during zigzags. Dotted lines show division into segments. (b) Box plot of median angular velocity and inter-quartile range (IQR) over the course of a zigzag. Ants tend to change direction of angular rotation at the peak and trough of each zigzag. Because the distance between peaks and troughs is variable, data from different zigzags are pooled by dividing each zig or zag into five equal segments, from 0 to 4, and averaging parameter values within a segment. (c) SLTs and incidents of facing the goal (within ±5°) occur mostly in segment 0, shortly after a change in the direction of rotation. These events are less frequent in later segments (+1 or +2) or in earlier segments (−1 or −2, counting back into the previous zig or zag). (d) Top: box plot (median, IQR and range) of the distribution of goal angles in each segment of 200 zigs or zags containing no SLTs; bottom: similar plot for 200 zigs or zags with an SLT in segment 0. Segments in which the median goal angle is significantly (p < 0.01) larger than in the top plot are indicated by double asterisks. Zigs or zags with SLTs have larger goal angles than those without in segments −1 and 0. By segment 1, goal angles are similar whether or not that zig or zag contained an SLT. (e) Grid in which 422 SLTs are each shown as a dot in one of the cells. Horizontal axis: segment in which SLT occurs. Vertical axis: goal angle at the endpoint of each SLT. (a–e) Adapted from [33].
Figure 4.
Figure 4.
How SLTs are affected by the jump of a pattern or its disappearance during an ant's approach to a visually defined goal (+). (a) Edge that ant approached jumped to left or right. (b) The frequency of SLTs before and after pattern jump (vertical dashed line) plotted against ant's distance from goal. Pattern jump is associated with brief increase in frequency of SLTs. Bins are 5 cm wide. (c) Grid in which each of 258 SLTs following a jump is shown as a dot in one of its cells. Horizontal axis indicates segment in which each SLT occurs. Vertical axis gives delay between jump of pattern and start of SLT. Segment 0 has the most SLTs. (d) Bar defining the position of goal (+) disappears. (e) Bar's disappearance (vertical dashed line) is associated with drop in frequency of SLTs. (f) Grid in which each of 91 SLTs following the bar's disappearance is shown as a dot in one of its cells. Horizontal axis shows segment in which SLT occurs and vertical axis shows the goal angle at end of the SLT. (g) The zigzag path to the goal (+) persists after the visual stimulus defining the goal disappears. (a) Adapted from [41]. (b–g) Adapted from [33].
Figure 5.
Figure 5.
Travel direction of the ant, Melophorus bagoti, in an artificial panoramic skyline. (a) 5 m route between nest and feeder. (b) Plastic replica of skyline. (c) Panorama viewed from feeder. (d) Replica oriented as the natural panorama. (e) Replica rotated clockwise by 150°. (f) Heading directions with replica as in (d) are measured when ant has walked 15 cm from the centre and displayed in a circular histogram. (g) Similar distribution of heading directions with replica oriented as in (e) Adapted from [48]. (Online version in colour.)
Figure 6.
Figure 6.
The use of fractional position of mass (FPM) as a visual cue to direction. (a) Facing directions at the end of SLTs during training to a feeder (F) that is inset 30° from a 160°-wide and 38°-high rectangle Stimulus angles are measured from the centre of the arena floor. (a)(i) Individual training trajectories to the feeder within a cylinder. Ants are released from the centre of the arena and approach a feeder 60 cm away. Black portions highlight the initial 30 cm of the path that are analysed. (a)(ii) Facing directions at the end of SLTs during initial 30 cm to the feeder. Bottom: rectangle with white bar marking the feeder position. Middle: contour plot of facing directions along the initial 30 cm (white, no SLTs; black, maximum frequency of SLTs). Dashed lines mark facing directions predicted by the use of FPM or of centre of mass (CoM) as computed at the start of the trajectory. Top: histogram of facing directions pooled over initial path. Bin width is 5°. The white arrow marks modal value. The grey horizontal bar below the histogram shows the mode and its 95% confidence interval. Sample sizes: A, number of ants; T, number of tracks; E, number of endpoints. (b,c) Facing directions during tests with 80° wide and 38° high rectangle (b) and wedge (c). The dashed bar on test patterns marks FPM corresponding to FPM of feeder on training pattern. The use of CoM predicts initial facing directions that lie significantly to the left of the mode of the test distributions as shown by labelled arrow. (a–c) Adapted from [57].
Figure 7.
Figure 7.
Facing directions of ants trained with a pattern of two abutting triangles. (a)(i)–(c)(i) Three groups of ants; each is trained to a different point (F) on the base of the left-hand triangle. a(ii),b(ii),c(ii)(iii) Facing directions in tests with rectangles. Dashed bars on patterns show the FPM of F when triangles are segmented and FPM is computed over the left-hand triangle (sFPM) or not segmented and computed over both triangles (wFPM). Modal facing directions in a(ii),b(ii) are aligned with sFPM. Modal facing directions in c(ii)(iii) are best predicted by wFPM. a(iii),b(iii) Tests with left-hand edge of rectangle slanted to match left-hand edge of triangle. Facing directions suggests ants are guided by the retinal position of the slanted edge (eLF). (a–c) Adapted from [57].

References

    1. Egelhaaf M, Boeddeker N, Kern R, Kurtz R, Lindemann JP. 2012. Spatial vision in insects is facilitated by shaping the dynamics of visual input through behavioral action. Front. Neural Circuits 6, 108 (10.3389/fncir.2012.00108) - DOI - PMC - PubMed
    1. Srinivasan MV. 2001. Honeybees as a model for the study of visually guided flight, navigation, and biologically inspired robotics. Physiol. Rev. 91, 389–411. - PubMed
    1. Zabala F, Polidoro P, Robie A, Branson K, Perona P, Dickinson MH. 2012. A simple strategy for detecting moving objects during locomotion revealed by animal–robot interactions. Curr. Biol. 22, 1344–1350. (10.1016/j.cub.2012.05.024) - DOI - PMC - PubMed
    1. Taylor GK, Krapp HG. 2007. Sensory systems and flight stability: what do insects measure and why? Adv. Insect Physiol. 34, 231–316.
    1. Borst A. 1990. How do flies land? BioScience 40, 292–299. (10.2307/1311266) - DOI

LinkOut - more resources