Review
. 2014 Jan;7(1):21-9.
doi: 10.1242/dmm.012146.

Selective vulnerability to neurodegenerative disease: the curious case of Prion Protein

Affiliations
Review

Selective vulnerability to neurodegenerative disease: the curious case of Prion Protein

Walker S Jackson. Dis Model Mech. 2014 Jan.

Abstract

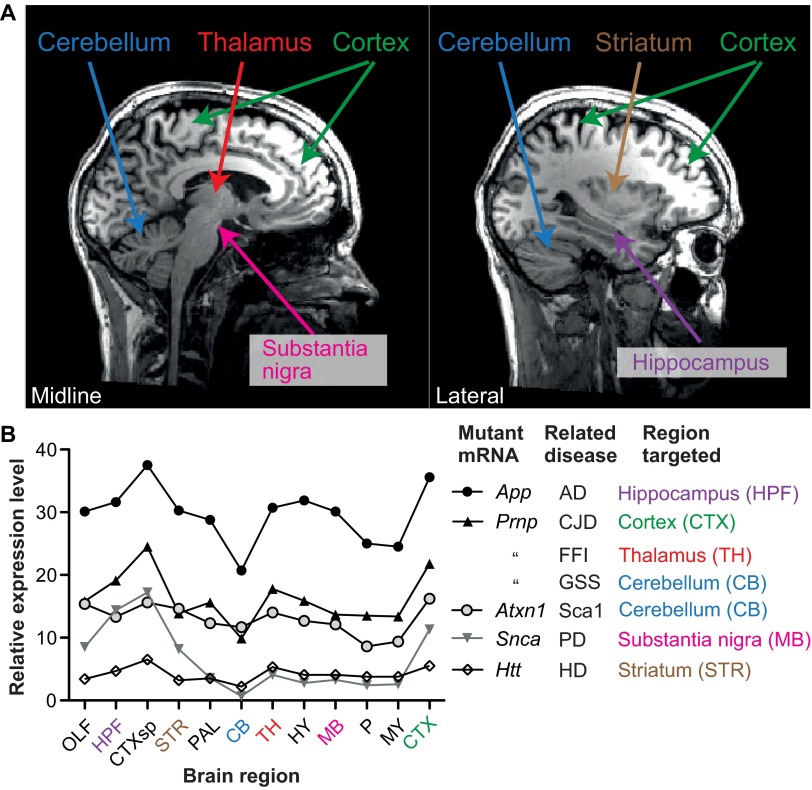
The mechanisms underlying the selective targeting of specific brain regions by different neurodegenerative diseases is one of the most intriguing mysteries in medicine. For example, it is known that Alzheimer's disease primarily affects parts of the brain that play a role in memory, whereas Parkinson's disease predominantly affects parts of the brain that are involved in body movement. However, the reasons that other brain regions remain unaffected in these diseases are unknown. A better understanding of the phenomenon of selective vulnerability is required for the development of targeted therapeutic approaches that specifically protect affected neurons, thereby altering the disease course and preventing its progression. Prion diseases are a fascinating group of neurodegenerative diseases because they exhibit a wide phenotypic spectrum caused by different sequence perturbations in a single protein. The possible ways that mutations affecting this protein can cause several distinct neurodegenerative diseases are explored in this Review to highlight the complexity underlying selective vulnerability. The premise of this article is that selective vulnerability is determined by the interaction of specific protein conformers and region-specific microenvironments harboring unique combinations of subcellular components such as metals, chaperones and protein translation machinery. Given the abundance of potential contributory factors in the neurodegenerative process, a better understanding of how these factors interact will provide invaluable insight into disease mechanisms to guide therapeutic discovery.

Keywords: Huntington’s disease; Knock-in mice; Neurodegeneration; Neuropathology; Prion diseases; Spinocerebellar ataxia.


Figures

Fig. 1
Fig. 1
Different brain regions affected by different familial PrDs. (A) A powerful technique employed by neurologists to diagnose disease is to non-invasively look at a patient’s brain using magnetic resonance imaging (MRI). Two images in the sagittal plane from a healthy individual facing right are used as maps to indicate the regions affected in various neurodegenerative diseases and to highlight that the regions are widely distributed. The image on the left is at the mid-line, the other image is parallel but towards one side. (B) A line chart showing the spatial distribution of mRNAs that cause specific neurodegenerative diseases when mutated. These data were measured by in situ hybridization of the adult mouse brain. Expression levels are not appreciably higher in the areas that are targeted. Data were acquired from the Allen Brain Atlas website (www.brain-map.org). Brain region abbreviations: OLF, olfactory bulb; HPF, hippocampus; CTXsp, subregion of the cortex (bottom of the brain); STR, striatum; PAL, pallidum; CB, cerebellum; TH, thalamus; HY, hypothalamus; MB, midbrain; P, pons; MY, medulla; CTX, cortex (main region on top of the brain).
Fig. 2
Fig. 2
The thalamus and hippocampus are intertwined in the mouse brain. (A) A computer rendering of the mouse brain oriented so that, in an intact mouse, it would be facing slightly to the right of the observer. (B) The same model as in A but with the external regions made translucent so that the space occupied by the thalamus can be observed. (C) The same model as in B but with the hippocampus highlighted instead. (D) The hippocampus and thalamus shown together. These images were created on the Allen Brain Atlas website (www.brain-map.org).
Fig. 3
Fig. 3
A surprising distribution of ribosomal protein mRNAs in the brain. Small and large ribosomal subunit proteins are encoded by Rps and Rpl mRNAs, respectively. A small subunit binds to mRNAs first and recruits the large subunit for translation. A variable expression pattern of components of both subunits in the mouse brain suggests the existence of extra layers of gene regulation that were previously unrecognized. Data were acquired from the Allen Brain Atlas website (www.brain-map.org). The data were systematically normalized and therefore comparable to the mRNA distributions in Fig. 1. Abbreviations: OLF, olfactory bulb; HPF, hippocampus; CTXsp, subregion of the cortex (bottom of the brain); STR, striatum; PAL, pallidum; CB, cerebellum; TH, thalamus; HY, hypothalamus; MB, midbrain; P, pons; MY, medulla; CTX, cortex (main region on top of the brain).
Fig. 4
Fig. 4
Models of protein aggregate spread. Three models of how the localization of aggregates in the brain might change as neurodegenerative disease progresses. (A) Moving aggregates. Aggregates generated in one region physically move to another, covering a large distance. (B) Serial dysfunction. Due to network dysfunction, conditions inducing de novo synthesis of protein aggregates move across the brain. (C) Falling dominoes. Similar to serial dysfunction, where conditions permissive to aggregate formation move, but with the distinction that misfolded protein aggregates seed the formation of new aggregates in close proximity, creating a chain reaction. The lightning bolts represent induction of conditions in different brain regions that accommodate the appearance of protein aggregates. Conditions might include aberrant network activity or impairment of protein quality-control machinery. The arrows in A show that an aggregate formed in the left end of the brain moves towards the right end. The dots in C represent small oligomeric misfolded protein seeds, which spread and can form full size aggregates once permissive conditions are present (lightning bolt) but not in areas without permissive conditions (above and below the aggregates).

References

    1. Aguzzi A., Rajendran L. (2009). The transcellular spread of cytosolic amyloids, prions, and prionoids. Neuron 64, 783–790 - PubMed
    1. Aguzzi A., Barres B. A., Bennett M. L. (2013). Microglia: scapegoat, saboteur, or something else? Science 339, 156–161 - PMC - PubMed
    1. Aidt F. H., Hasholt L. F., Christiansen M., Laursen H. (2013). Localization of A11-reactive oligomeric species in prion diseases. Histopathology 62, 994–1001 - PubMed
    1. Alais S., Simoes S., Baas D., Lehmann S., Raposo G., Darlix J. L., Leblanc P. (2008). Mouse neuroblastoma cells release prion infectivity associated with exosomal vesicles. Biol. Cell 100, 603–618 - PubMed
    1. Apetri A. C., Surewicz K., Surewicz W. K. (2004). The effect of disease-associated mutations on the folding pathway of human prion protein. J. Biol. Chem. 279, 18008–18014 - PubMed

Publication types