. 2013:2013:587543.
doi: 10.1155/2013/587543. Epub 2013 Dec 16.

Using state variables to model the response of tumour cells to radiation and heat: a novel multi-hit-repair approach

Affiliations

Using state variables to model the response of tumour cells to radiation and heat: a novel multi-hit-repair approach

Stephan Scheidegger et al. Comput Math Methods Med. 2013.

Abstract

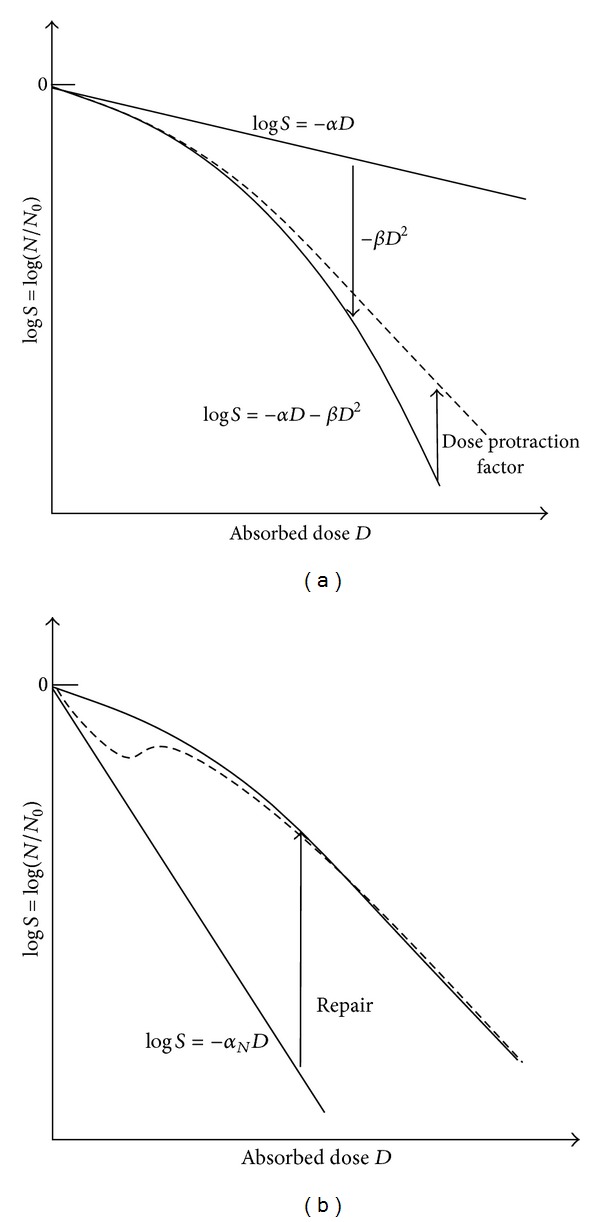
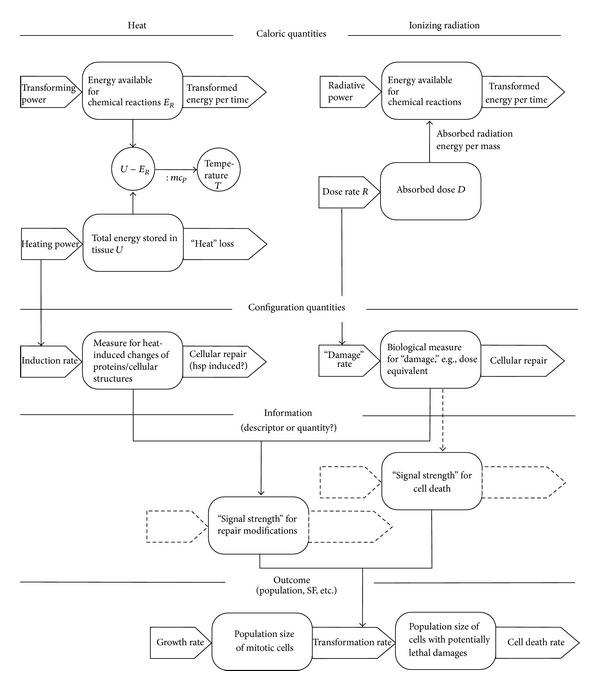
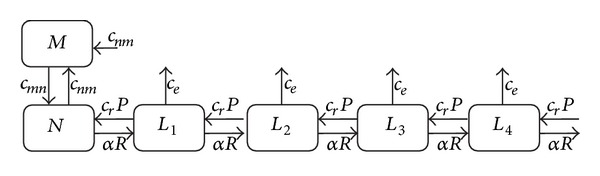
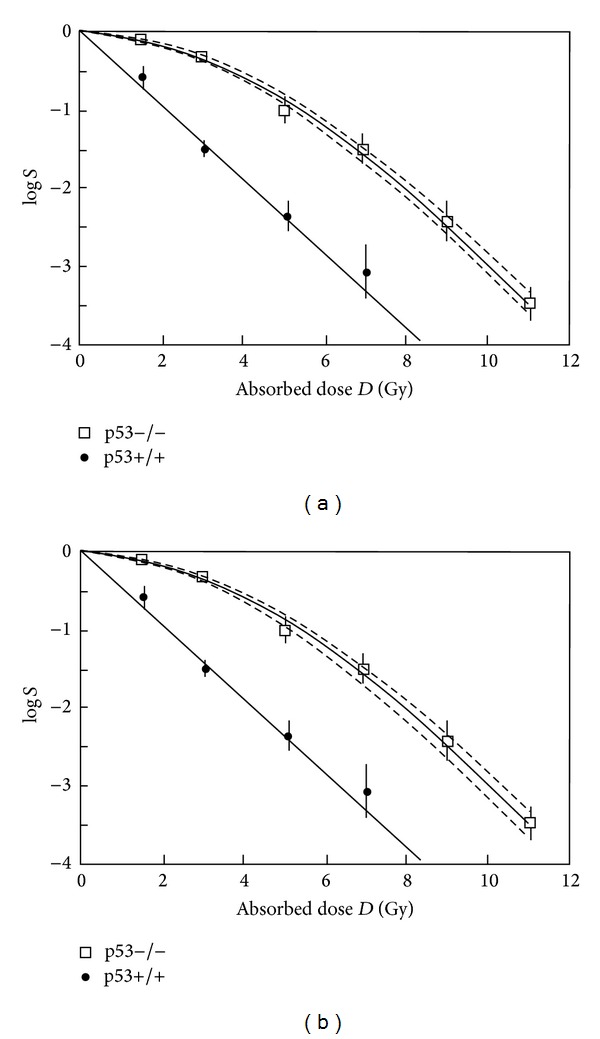
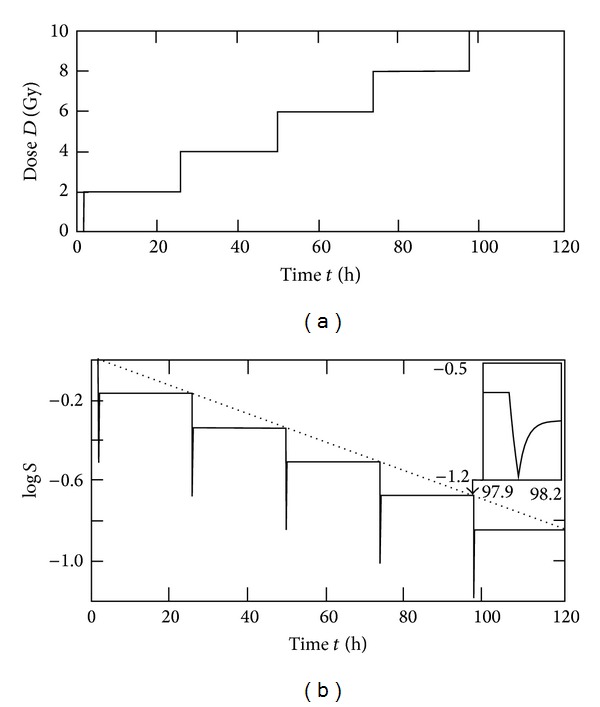
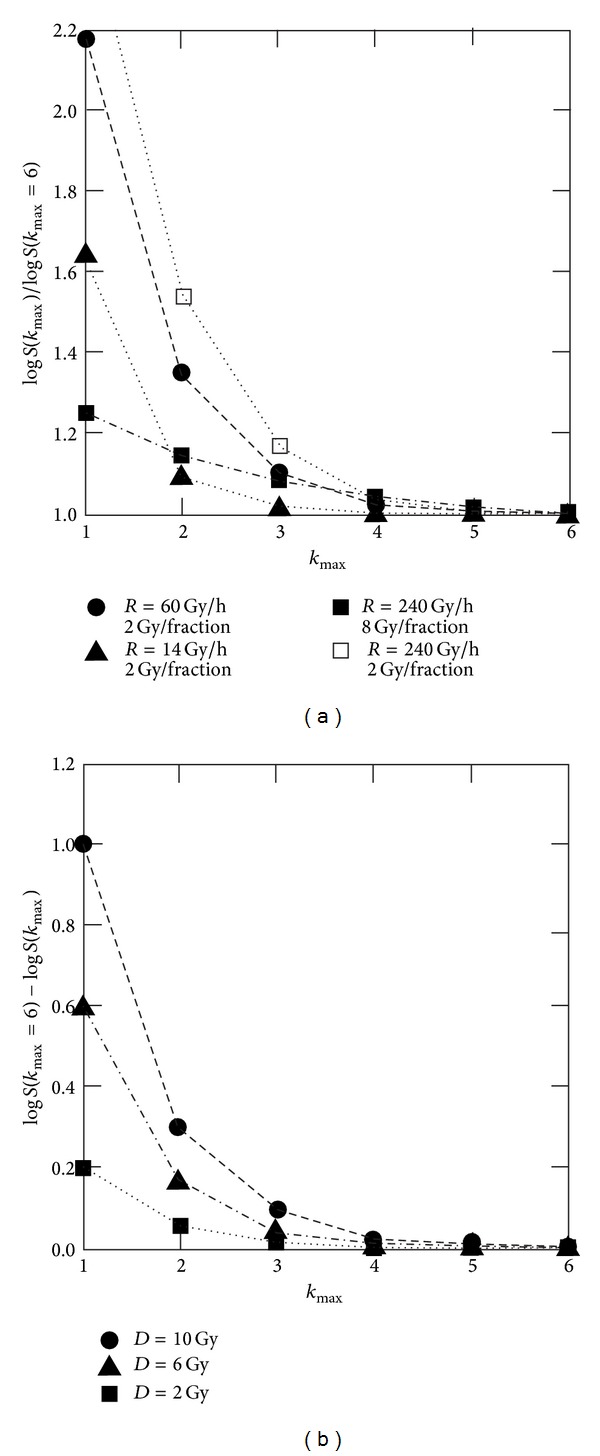
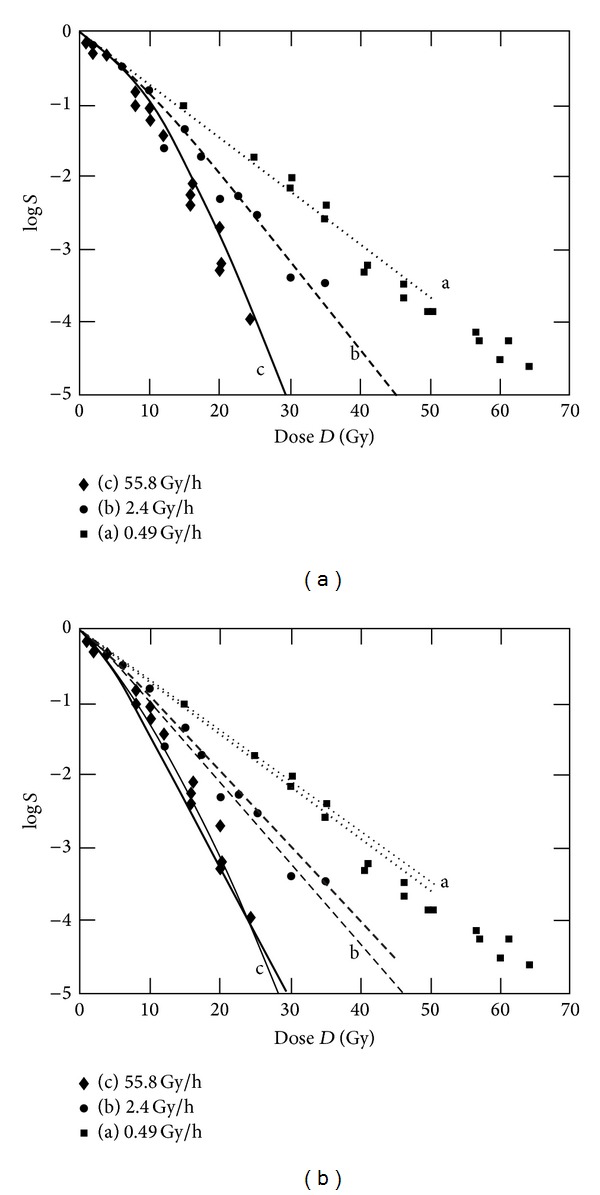
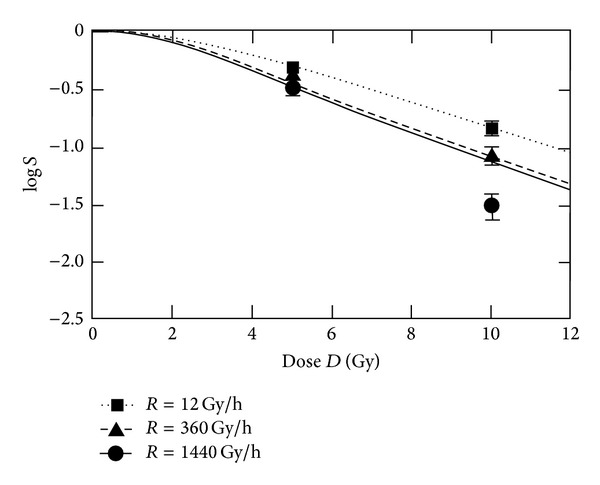
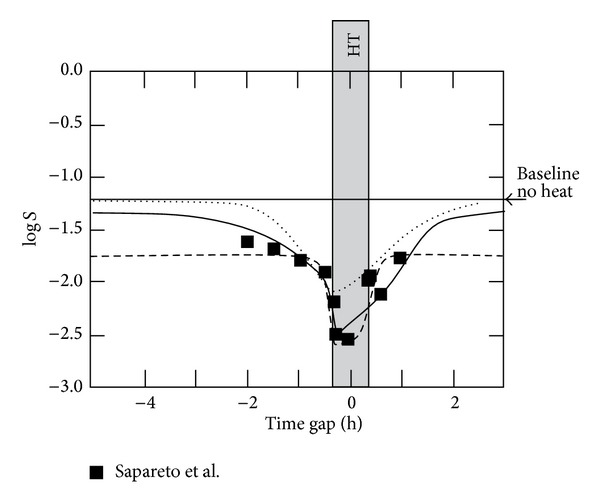
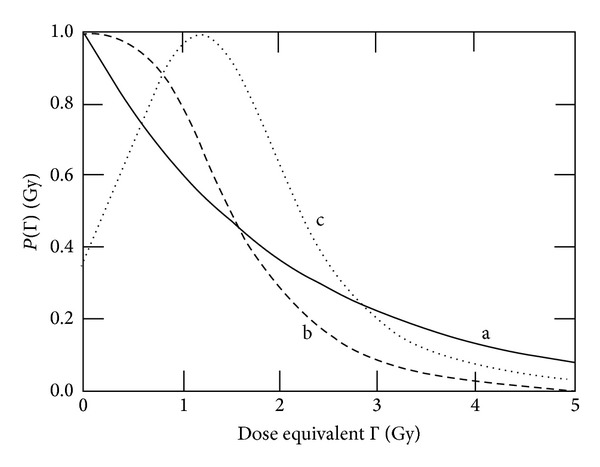
In order to overcome the limitations of the linear-quadratic model and include synergistic effects of heat and radiation, a novel radiobiological model is proposed. The model is based on a chain of cell populations which are characterized by the number of radiation induced damages (hits). Cells can shift downward along the chain by collecting hits and upward by a repair process. The repair process is governed by a repair probability which depends upon state variables used for a simplistic description of the impact of heat and radiation upon repair proteins. Based on the parameters used, populations up to 4-5 hits are relevant for the calculation of the survival. The model describes intuitively the mathematical behaviour of apoptotic and nonapoptotic cell death. Linear-quadratic-linear behaviour of the logarithmic cell survival, fractionation, and (with one exception) the dose rate dependencies are described correctly. The model covers the time gap dependence of the synergistic cell killing due to combined application of heat and radiation, but further validation of the proposed approach based on experimental data is needed. However, the model offers a work bench for testing different biological concepts of damage induction, repair, and statistical approaches for calculating the variables of state.


Figures

Figure 1
Figure 1
Comparison of two different concepts for describing cell killing or cell survival (schematic illustration). The left diagram (a) shows a correcting down approach (bending down principle by a term describing additional cell killing due to previously acquired sub-lethal lesions). To correct the curve to the observed linear-quadratic-linear shape and to include dose rate dependences, dose protraction factors (e.g., Lea-Catcheside dose protraction factor [1, 6]) have been proposed. The right diagram (b) illustrates a correcting up approach due to the repair of potentially lethal lesions. If the activation of repair will need a certain dose, low dose hypersensitivity (dashed curve) can be explained [23].
Figure 2
Figure 2
General model structure as a model framework. The structures consisting of boxes and thick arrows symbolise integrators. In the case of extensive quantities, the boxes can be regarded as storage elements and the arrows as flows. The left side of the diagram illustrates the effect of heat, the right side the effect of radiation. The population model is drawn in a simplistic manner. For the MHR model, a chain of population is used (see Section 2.3). In constructing this scheme, we have been critical of attempts to conflate concepts of thermodynamic entropy, statistical entropy, and information. We believe that distinguishing between the three (as caloric, number of configurations and information) leads to advances in understanding systems and processes. See also Corning and Kline [25, 26].
Figure 3
Figure 3
Illustration of the population model. The model flow chart includes a mitotic cell population as well (population size M). The flows (rates) between the populations can be found by multiplying the given constants by the corresponding population size (population where the arrow starts). P is the repair probability from (6).
Figure 4
Figure 4
Fit of cell survival in the case of apoptotic (p53+/+) and nonapoptotic (p53−/−) cell death. The solid straight line is given by log⁡⁡S = −(1.1 · log⁡e) · D. The dashed lines indicate the standard deviation calculated for varying repair parameters, (a) variation of c r between 84 and 120 h−1; (b) variation of μ Γ in the range of 0.45–0.55 Gy−1.
Figure 5
Figure 5
Fractionated radiotherapy course used for cutoff evaluation: (a) For every dose step (fraction of 2 Gy), a constant reduction of log⁡⁡S results. Therefore, the (upper) envelope in (b) is characterized by a straight line (dotted line in the lower figure). This corresponds with the concept of Oliver [7] and the radiobiological models of Curtis [15] and Scheidegger [18] and represents the case of complete repair.
Figure 6
Figure 6
Effect of cutoff of the population chain at different dose rates R. In the left diagram, factors between log⁡⁡S-values for a specific k max⁡ and logS-values k max⁡ = 6 are shown. These values exhibit a nonlinear dose rate dependence but are nearly independent of the cumulative dose for a specific fractionation scheme (2 Gy fractions according to Figure 5). The situation becomes different for larger doses per fraction (example in the Figure 8 Gy fractions). Due to the high dose rate and the low γ-value (1.45 h−1), the dose equivalent Γ does not reach a steady state and rises up to approximately 8 Gy (7.83 Gy). This leads to a higher repair rate and therefore to a slightly higher influence of the populations with k < 1. In the right diagram, the differences of the log⁡⁡S-values are given. This quantity is dependent of the cumulative dose (in this figure applied in fractions of 2 Gy) and can be approximated by an exponential function (for the discrete values of k max⁡).
Figure 7
Figure 7
Fit of experimental data form Wells and Bedford [5]. C3H10T1/2 cells with the LQ parameters α = 0.1366 Gy−1 and β = 0.02 Gy−2, irradiated at different dose rates. The parameters used for fitting are given in Table 2. (a) shows a fit which corresponds to the fit of Curtis [15] using the LPL model, (b) shows two, not optimized fits with higher values for c r and c e.
Figure 8
Figure 8
Clonogenic survival of T98G glioblastoma cells at different dose rates. The parameter values for fitting are α = 0.27 Gy−1, γ = 1.45 h−1, c r = 90 h−1, c e = 19 h−1, and μ Γ = 0.8 Gy−1.
Figure 9
Figure 9
Fit of experimental data (redrawn) from Sapareto et al. [13]. Chinese hamster cells were irradiated with 5 Gy prior (negative time gap) or after heat (positive time gap). Heat (HT) is applied during 40 min (±20 min of point 0 on the time gap axis). Temperature T during heating was 42.5°C. Heat specific parameter values are given in Table 3. Radiation specific parameter values: solid line (optimized) α = 1.89 Gy−1, c r = 191.7 h−1, c e = 0.97 h−1, μ Γ = 0.96 Gy−1, γ = 6.77 · 10−3 Gy−1; dotted line (not optimized) α = 1.1 Gy−1, c r = 6.1 h−1, c e = 2 h−1, μ Γ = 0.5 Gy−1, γ = 1.45 Gy−1; dashed line (optimized without baseline points) α = 1.18 Gy−1, c r = 6.42 h−1, c e = 8.92 h−1, μ Γ = 0.096 Gy−1, γ = 0.699 Gy−1.
Figure 10
Figure 10
Different approaches for describing the dose equivalent dependence of the repair probability. (a) Exponential function with μ Γ = 0.5 Gy−1 as used in Sections 3.2−3.4, (b) sigmoidal function, and (c) possible function in the case of low dose hypersensitivity.

References

    1. Lea DE, Catcheside DG. The mechanism of the induction by radiation of chromosome aberrations in Tradescantia. Journal of Genetics. 1942;44(2-3):216–245.
    1. Jones B, Dale RG, Deehan C, Hopkins KI, Morgan DA. The role of biologically effective dose (BED) in clinical oncology. Clinical Oncology. 2001;13(2):71–81. - PubMed
    1. Chadwick KH, Leenhouts HP. A molecular theory of cell survival. Physics in Medicine and Biology. 1973;18(1, article 7):78–87. - PubMed
    1. Guerrero M, Li XA. Extending the linear-quadratic model for large fraction doses pertinent to stereotactic radiotherapy. Physics in Medicine and Biology. 2004;49(20):4825–4835. - PubMed
    1. Wells RL, Bedford JS. Dose-rate effects in mammalian cells. IV. Repairable and nonrepairable damage in noncycling C3H10T1/2 cells. Radiation Research. 1983;94(1):105–134. - PubMed

Substances