

Current approaches, challenges and future directions for monitoring treatment response in prostate cancer
- PMID: 24396494
- PMCID: PMC3881217
- DOI: 10.7150/jca.7709
Current approaches, challenges and future directions for monitoring treatment response in prostate cancer
Abstract
Prostate cancer is the most commonly diagnosed non-cutaneous neoplasm in men in the United States and the second leading cause of cancer mortality. One in 7 men will be diagnosed with prostate cancer during their lifetime. As a result, monitoring treatment response is of vital importance. The cornerstone of current approaches in monitoring treatment response remains the prostate-specific antigen (PSA). However, with the limitations of PSA come challenges in our ability to monitor treatment success. Defining PSA response is different depending on the individual treatment rendered potentially making it difficult for those not trained in urologic oncology to understand. Furthermore, standard treatment response criteria do not apply to prostate cancer further complicating the issue of treatment response. Historically, prostate cancer has been difficult to image and no single modality has been consistently relied upon to measure treatment response. However, with newer imaging modalities and advances in our understanding and utilization of specific biomarkers, the future for monitoring treatment response in prostate cancer looks bright.
Keywords: monitoring treatment response; prostate cancer.
Conflict of interest statement
Competing Interests: The authors have declared that no competing interest exists.
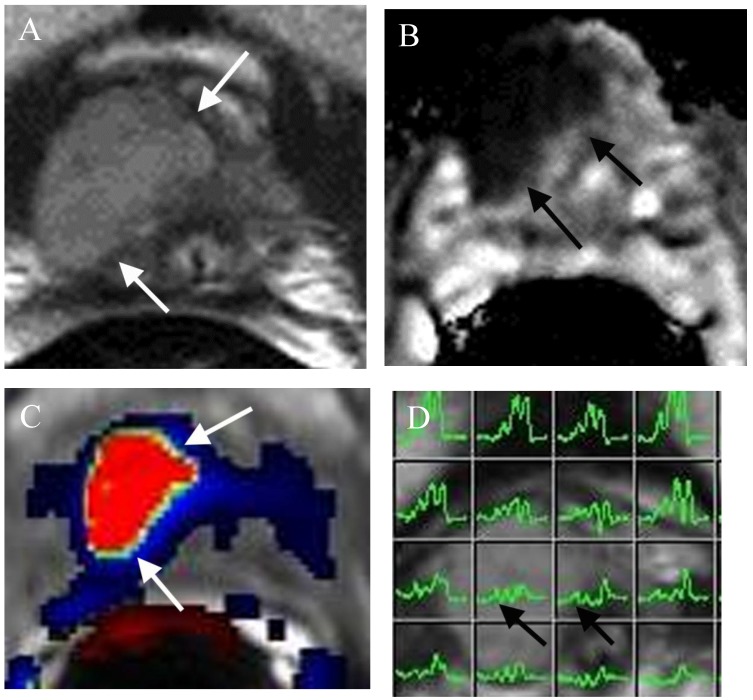
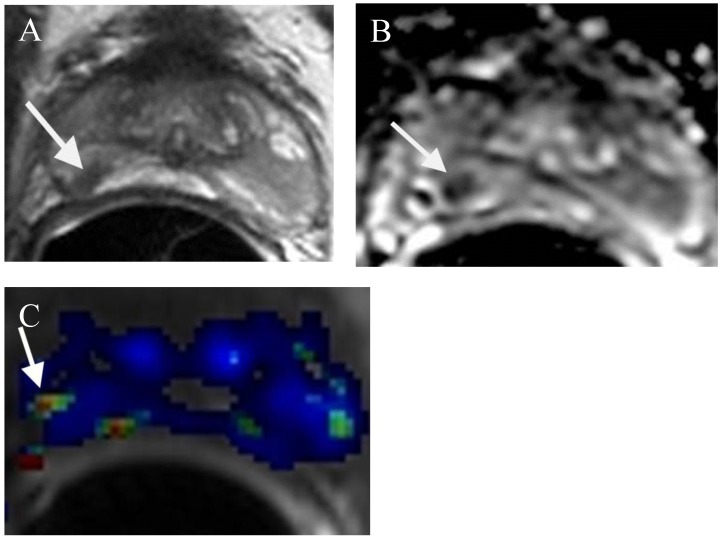
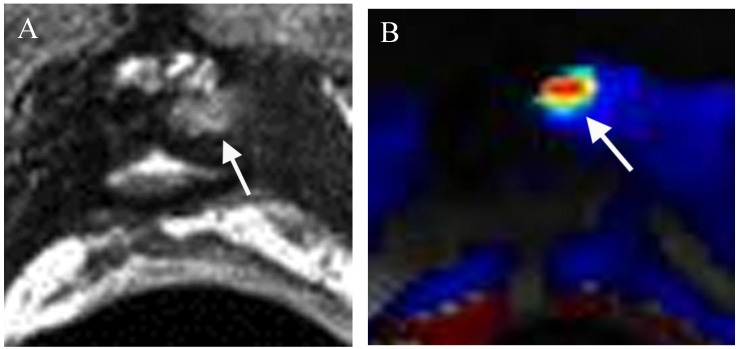
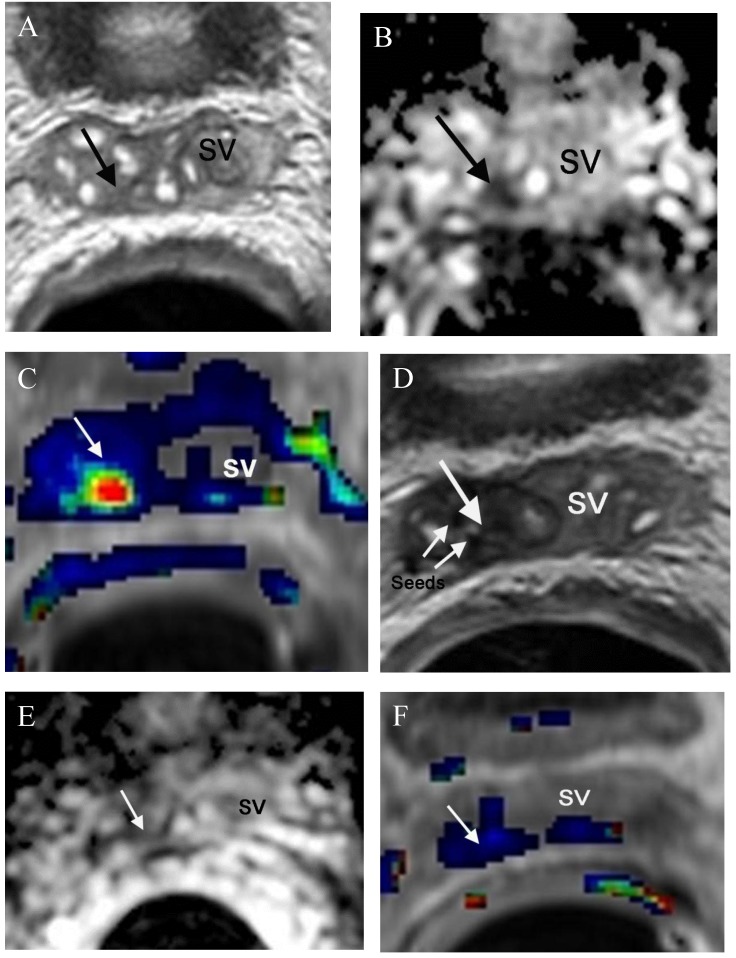
Figures
References
-
- Howladder N, Noone AM, Krapcho M, Garshell J, Neyman N, Altekruse SF, Kosary CL, Yu M, Ruhl J, Tatalovich Z, Cho H, Mariotto A, Lewis DR, Chen HS, Feur EJ, Cronin KA. SEER Cancer Statistics Review, 1975-2010, National Cancer Institute. Bethesda, MD. http://cancer.gov/csr/1975_2010/
-
- Clinical practice guidelines in oncology: prostate cancer. National Comprehensive Cancer Network (NCCN); http://www.nccn.org. - PubMed
-
- Alberta Provincial Genitourinary Tumour Team. Prostate cancer. Edmonton (Alberta): Alberta Health Services, Cancer Care; 2011. (Clinical practice guideline; no. GU-004)
-
- Thompson I. et al. Guideline for the management of clinically localized prostate cancer: 2007 update. J Urol. 2007;177(6):2106–2131. - PubMed
Publication types
LinkOut - more resources
Full Text Sources
Other Literature Sources
Medical
Research Materials
Miscellaneous
