. 2013 Oct 8;7(5):54114.
doi: 10.1063/1.4824480. eCollection 2013.

A microfluidic device for uniform-sized cell spheroids formation, culture, harvesting and flow cytometry analysis

Affiliations

A microfluidic device for uniform-sized cell spheroids formation, culture, harvesting and flow cytometry analysis

Bishnubrata Patra et al. Biomicrofluidics. .

Abstract

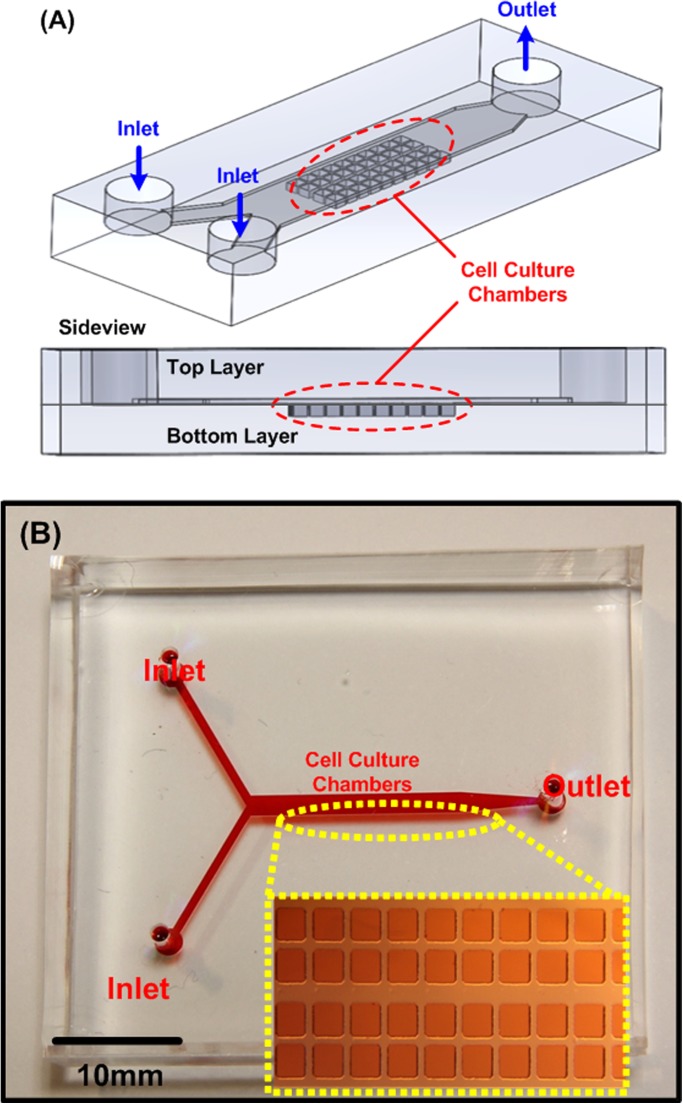
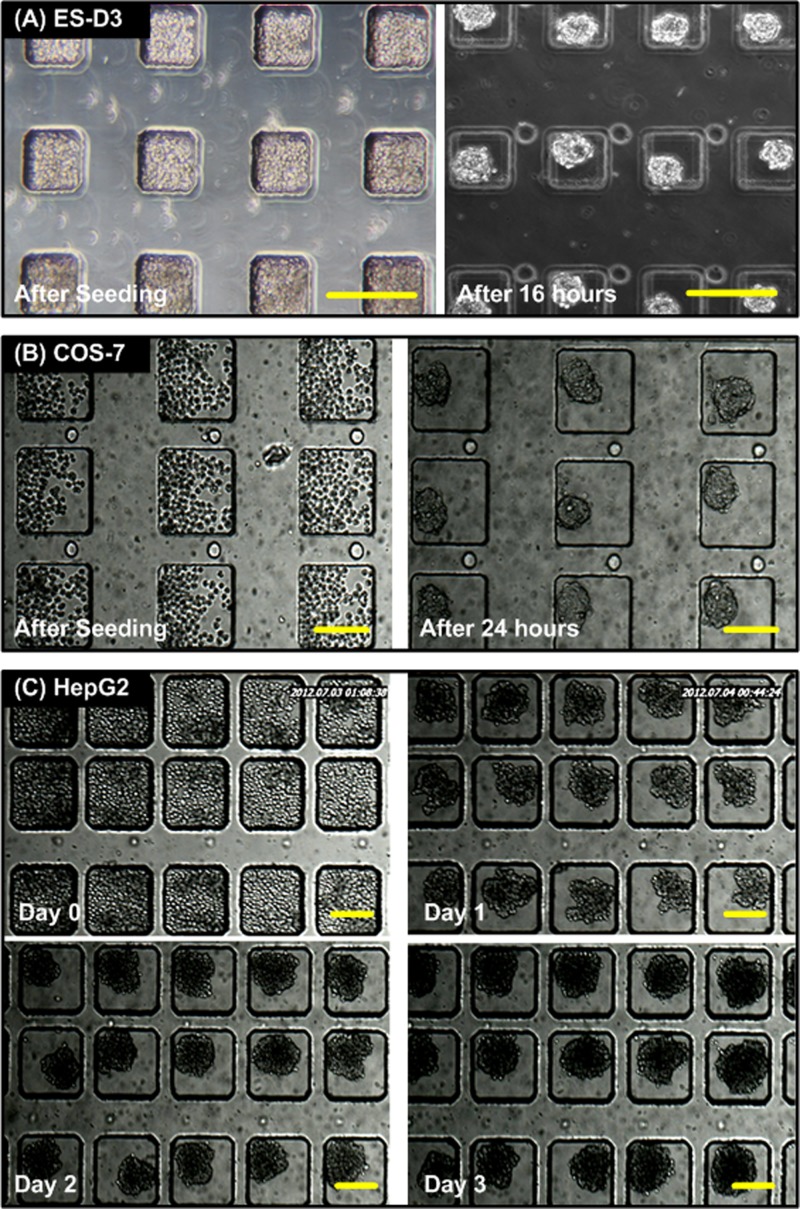
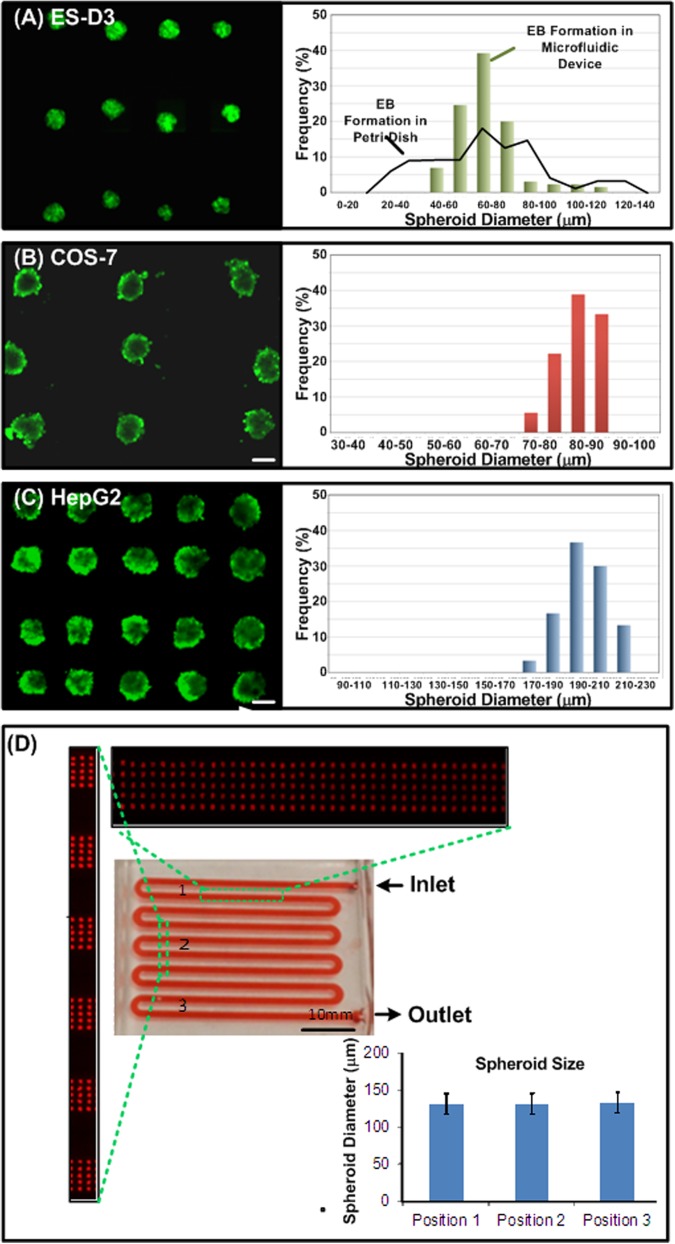
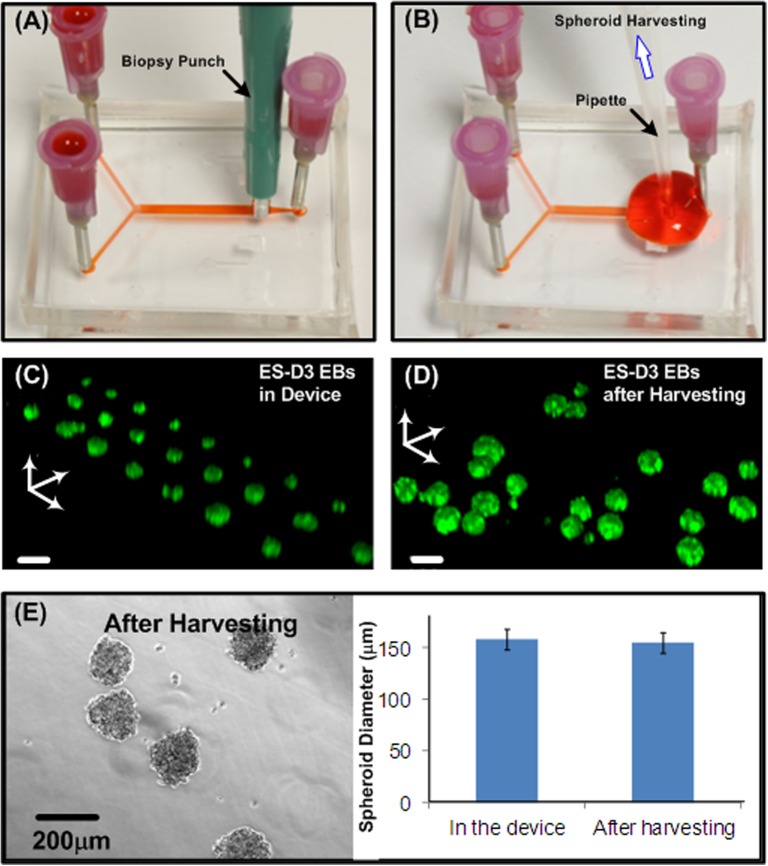
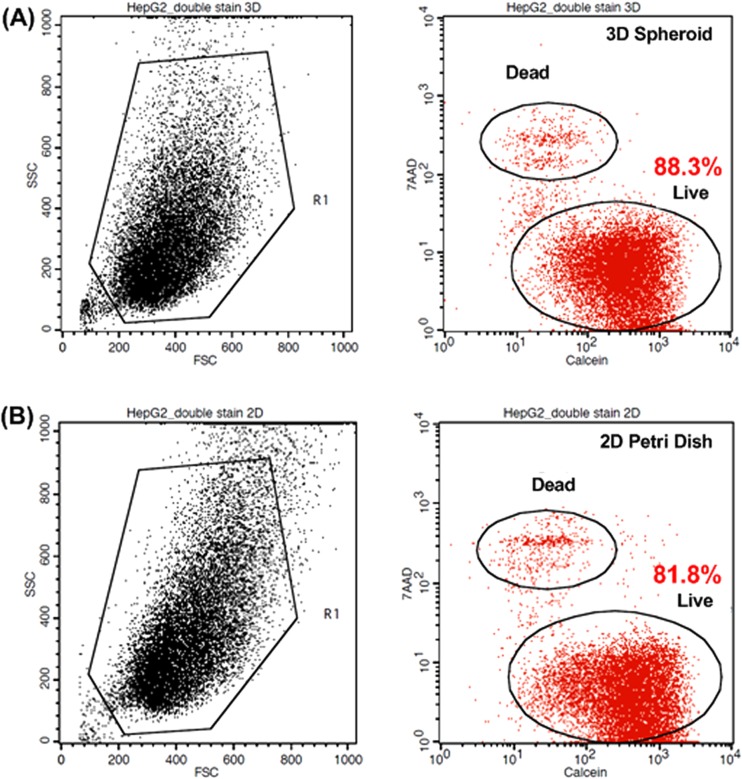
Culture of cells as three-dimensional (3D) aggregates, named spheroids, possesses great potential to improve in vitro cell models for basic biomedical research. However, such cell spheroid models are often complicated, cumbersome, and expensive compared to conventional Petri-dish cell cultures. In this work, we developed a simple microfluidic device for cell spheroid formation, culture, and harvesting. Using this device, cells could form uniformly sized spheroids due to strong cell-cell interactions and the spatial confinement of microfluidic culture chambers. We demonstrated cell spheroid formation and culture in the designed devices using embryonic stem cells, carcinoma cells, and fibroblasts. We further scaled up the device capable of simultaneously forming and culturing 5000 spheroids in a single chip. Finally, we demonstrated harvesting of the cultured spheroids from the device with a simple setup. The harvested spheroids possess great integrity, and the cells can be exploited for further flow cytometry assays due to the ample cell numbers.


Figures

Figure 1
Figure 1
(a) Illustrations of the developed bi-layer PDMS microfluidic device for spheroid formation and culture. (b) Photo of the fabricated microfluidic device filled with food dyes. The inset shows the microscopic image of the cell culture chambers.
Figure 2
Figure 2
Simulated particle trajectories inside the microfluidic device with various input flow rates. (a) and (b) At the flow rates of 1 and 10 μl/min the particles are trapped inside the cell culture chambers. (c) While the flow rate is increased to 100 μl/min, the particles are flushed out of the cell culture chamber.
Figure 3
Figure 3
Microscopic images of cell spheroid formation and culture inside the microfluidic devices. (a) ES-D3 cells right after seeding and after 16-h culture. (c) COS-7 cells right after seeding and after 24-h culture. (c) 4-day culture of HepG2 cells inside the device. The HepG2 cells aggregate and form spheroids after 1-day culture. The sizes of the spheroids are increased during the culture period. Scale bar is 200 μm.
Figure 4
Figure 4
Fluorescence microscopic images and size distributions of spheroids formed and cultured inside the microfluidic device. (a) EBs formed by Oct-4 GFP transfected ES-D3 cells show their well-maintained stemness. The histogram shows the more uniform size distribution of the EBs formed in the device compared to those formed in a Petri dish after 16-h culture. (b) and (c) Calcein AM-stained COS-7 (after 24-h culture) and HepG2 (at day 3) spheroids formed and cultured in the developed devices, respectively. The histograms show uniform spheroid size distributions of both cell types. (D) Photo of a device culturing 5000 DsRed-HepG2 spheroids for 3 days. Scale bar is 100 μm.
Figure 5
Figure 5
(a) and (b) Procedures to harvest cultured spheroids from the microfluidic device using a biopsy punch and a pipette. (c) Confocal microscopic image of Oct-4 GFP EBs formed and cultured in a microfluidic device. (d) Confocal microscopic image of Oct-4 GFP EBs harvested from a microfluidic device at day 2. Scale bar is 150 μm. (e) HepG2 (at day 3) spheroids harvested out from the device and quantitative size distribution before and after the harvesting.
Figure 6
Figure 6
(a) Flow cytometry analysis of dissociated HepG2 (without DsRed) spheroids. FSC, SSC plot and gate (left). Viability analysis using Calcein AM and 7-AAD (right) for HepG2 spheroids cultured for 3 days in the microfluidic device. (b) Flow cytometry analysis of HepG2 cultured in T75 flask for 3 days.

Similar articles

Cited by

References

    1. Pampaloni F., Reynaud E., and Stelzer E., Nat. Rev. Mol. Cell. Biol. 8, 839 (2007).10.1038/nrm2236 - DOI - PubMed
    1. Bartosh T., Ylöstalo J., Mohammadipoor A., Bazhanov N., Coble K., Claypool K., Lee R., Choi H., and Prockop D., Proc. Natl. Acad. Sci. U.S.A. 107, 13724 (2010).10.1073/pnas.1008117107 - DOI - PMC - PubMed
    1. Sutherland R., Science 240, 177 (1988).10.1126/science.2451290 - DOI - PubMed
    1. Tung Y.-C., Hsiao A., Allen S., Torisawa Y., Ho M., and Takayama S., Analyst 136, 473 (2011).10.1039/c0an00609b - DOI - PMC - PubMed
    1. Hwang Y., Chung B., Ortmann D., Hattori N., Moeller H., and Khademhosseini A., Proc. Natl. Acad. Sci. U.S.A. 106, 16978(2009).10.1073/pnas.0905550106 - DOI - PMC - PubMed