

Growth rate of melanoma in vivo and correlation with dermatoscopic and dermatopathologic findings
- PMID: 24396722
- PMCID: PMC3881085
- DOI: 10.5826/dpc.dp0101a13
Growth rate of melanoma in vivo and correlation with dermatoscopic and dermatopathologic findings
Abstract
Objectives: The aim of this study was to calculate the horizontal growth rate of melanoma in vivo and to correlate it with morphologic findings.
Patients and methods: We searched our database for melanomas for which sequential dermatoscopic images and histopathologic slides were available. The final sample consisted of 50 melanomas of 48 patients (mean age: 50 ± 15 years, 62% females). We calculated the horizontal growth rate in mm(2) per year by morphometric analysis of digital dermatoscopic images. Dermatoscopic and dermatopathologic findings were assessed according to predefined criteria and correlated with the horizontal growth rate.
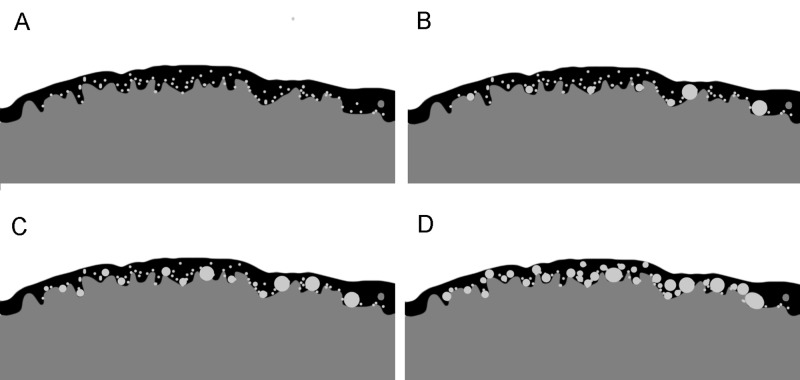
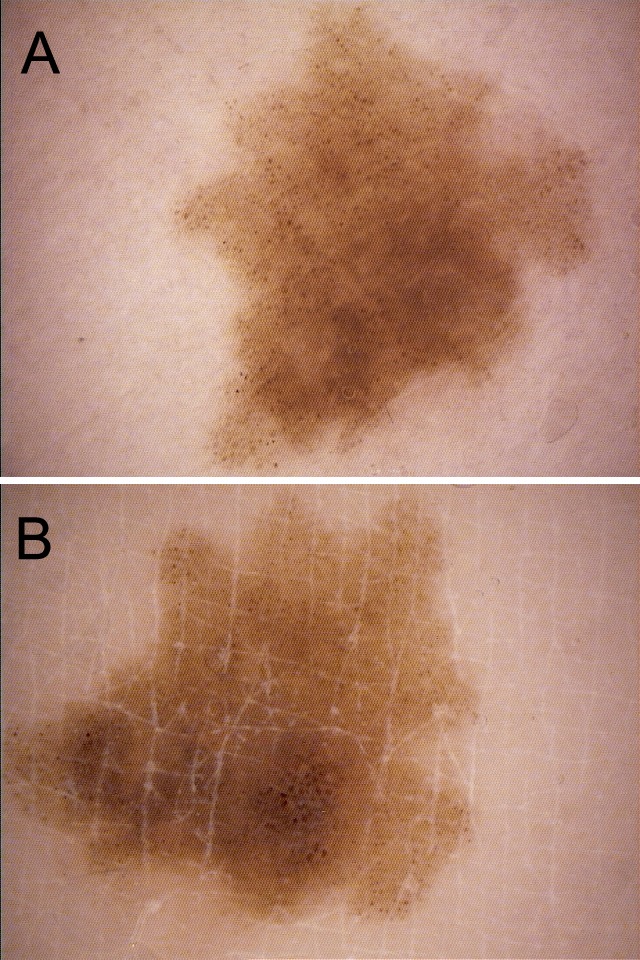
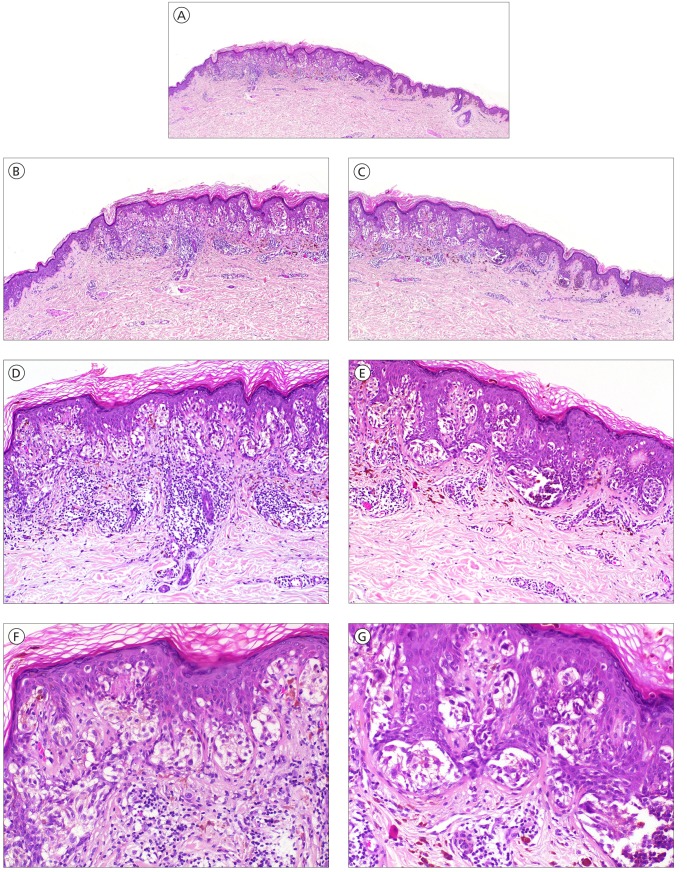
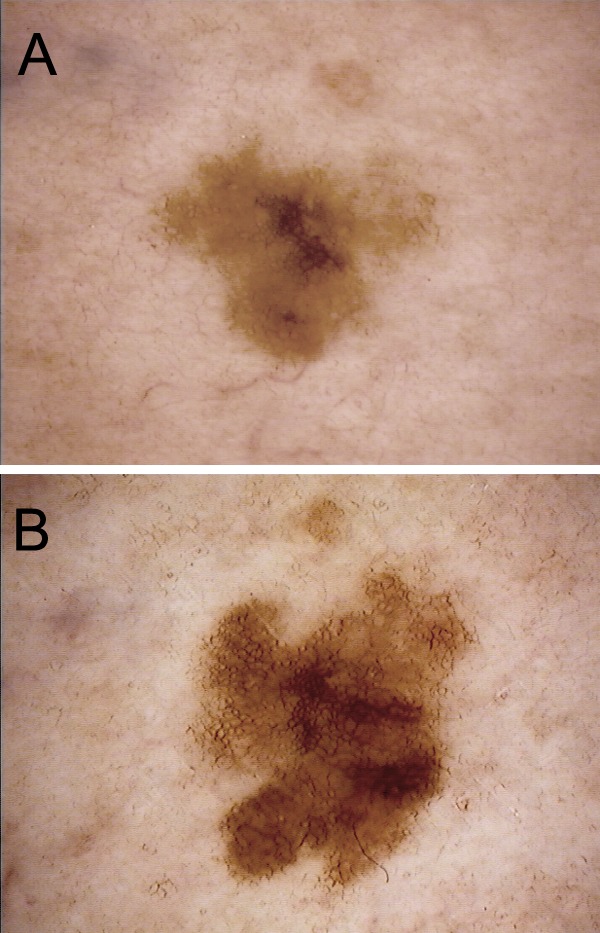
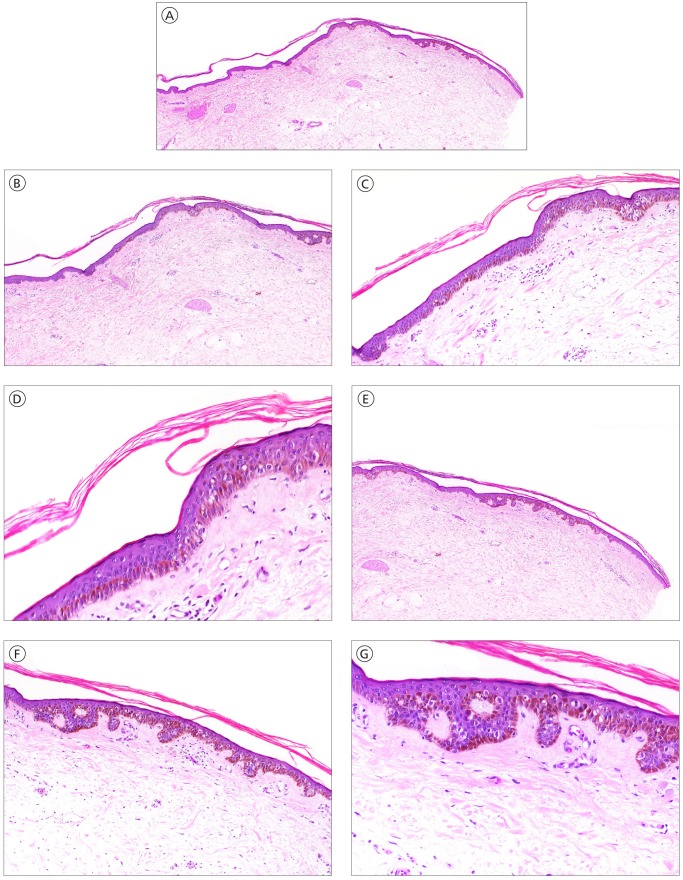
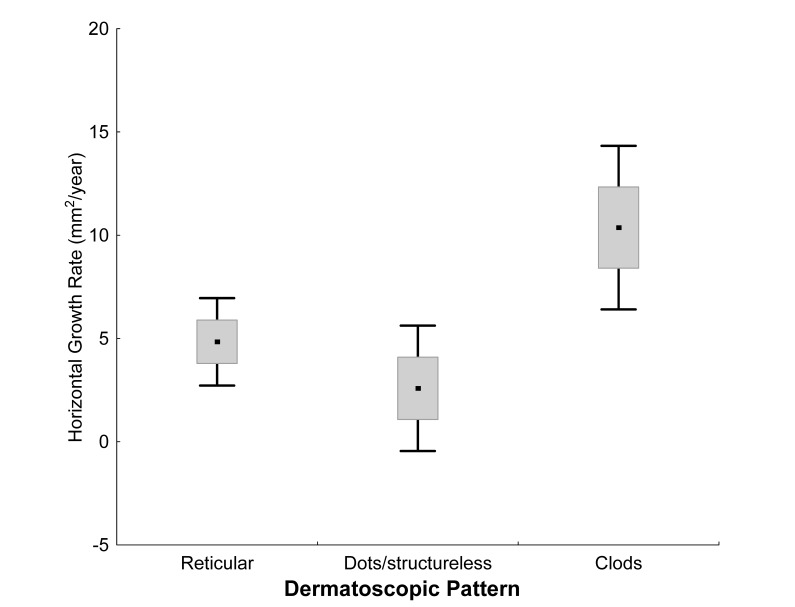
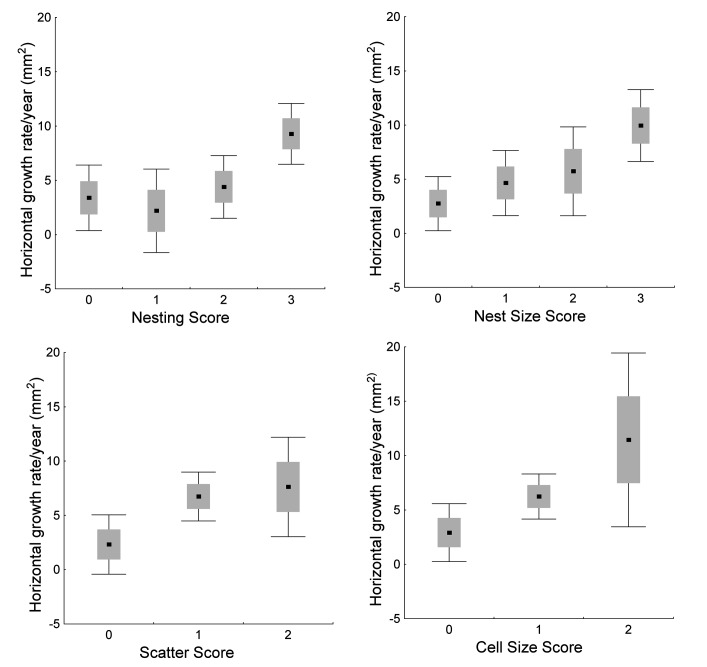
Results: The median time interval between baseline and follow-up image was 12 months (range: 2-100 months). The majority of melanomas were in situ (n=28, 56%). The mean horizontal growth rate of all melanomas was 5.3 mm(2)/year (SD: ± 5.8 mm(2)/year). The histopathologic findings of numerous and large epidermal nests were associated with rapid growth. This histopathologic pattern corresponded to a pattern of clods ("globules") dermatoscopically. From a dermatoscopic point of view, melanomas with a main pattern of clods grew significantly faster (mean horizontal growth rate: 10.4 mm(2)/year, 95% CI: 6.4-14.4 mm(2)/year) than melanomas with mainly a reticular pattern (4.8 mm(2)/year, 95% CI: 2.7-7.0 mm(2)/year) or with other patterns (2.6 mm(2)/year, 95% CI: -0.5-5.6 mm(2)/ year, p=0.01).
Conclusion: Morphologic characteristics of melanoma are associated with biologic behavior. Large and numerous epidermal nests (corresponding to a pattern of clods dermatoscopically) indicate more rapid growth.
Keywords: dermotoscopy; horizontal growth rate; melanoma in vivo.
Figures
References
-
- Clark WH, Jr, From L, Bernardino EA, Mihm MC. The histogenesis and biologic behavior of primary human malignant melanomas of the skin. Cancer Res. 1969;29(3):705–27. - PubMed
-
- Grob JJ, Richard MA, Gouvernet J, et al. The kinetics of the visible growth of a primary melanoma reflects the tumor aggressiveness and is an independent prognostic marker: a prospective study. Int J Cancer. 2002;102(1):34–8. - PubMed
-
- Liu W, Dowling JP, Murray WK, et al. Rate of growth in melanomas: characteristics and associations of rapidly growing melanomas. Arch Dermatol. 2006;142(12):1551–8. - PubMed
-
- Kittler H. Dermatoscopy: introduction of a new algorithmic method based on pattern analysis for diagnosis of pigmented skin lesions. Dermatopathology: Practical & Conceptual. 2007;13(1):3.
LinkOut - more resources
Full Text Sources
Other Literature Sources