Review
. 2013 Sep;15(3):164-73.
doi: 10.5853/jos.2013.15.3.164. Epub 2013 Sep 27.

Perfusion patterns of ischemic stroke on computed tomography perfusion

Affiliations
Review

Perfusion patterns of ischemic stroke on computed tomography perfusion

Longting Lin et al. J Stroke. 2013 Sep.

Abstract

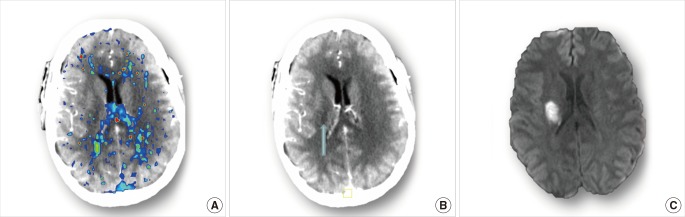
CT perfusion (CTP) has been applied increasingly in research of ischemic stroke. However, in clinical practice, it is still a relatively new technology. For neurologists and radiologists, the challenge is to interpret CTP results properly in the context of the clinical presentation. In this article, we will illustrate common CTP patterns in acute ischemic stroke using a case-based approach. The aim is to get clinicians more familiar with the information provided by CTP with a view towards inspiring them to incorporate CTP in their routine imaging workup of acute stroke patients.

Keywords: CT perfusion; Case study; Perfusion pattern; ischemic stroke.


Conflict of interest statement

The authors have no financial conflicts of interest.

Figures

Figure 1
Figure 1
Baseline brain images of Case1. Acute CTA shows occlusion of the proximal M2 segment of left middle cerebral artery (blue arrow), which results in lesions on CTP maps as prolonged MTT and DT, and decreased CBF and CBV in the left MCA territory. By setting thresholds to DT and CBF, acute CTP differentiates penumbra (green) from infarct core (red). This patient has a small infarct core with relatively big penumbra.
Figure 2
Figure 2
Tissue outcome of Case 1 and Case 2. Both cases have a 'favourable penumbral pattern' on acute CTP, and both received thrombolytic treatment. In Case 1, follow-up DWI (24 hours) shows small lesions that correspond to pre-treatment infarct core map, with complete salvage of penumbra. In Case 2, there is a large infarct at 24 hours representing the progression of pre-treatment penumbral tissue to infarction. Note that both cases had normal baseline NCCT with no early ischemic changes.
Figure 3
Figure 3
Brain imaging of Case 3. Acute CTP (A) reveals a big infarct core (red) with limited penumbra (green), while no obvious abnormality is shown in acute NCCT(B). Acute CTA (D, blow arrow) shows the existence of occlusion on M2 segment of MCA. Thrombolytic treatment was given to this patient. Follow-up MRA (E, blow arrow) confirms the recanalization of the occlusion. Follow-up DWI (C) shows a big infarct consistent with the pre-treatment CTP core map.
Figure 4
Figure 4
Acute CTP images of Case 4. It shows a region in right MCA territory with reduced CBV and CBF, and a larger region with prolonged MTT and DT. Penumbra and core volume is similar in this case, with 32 mL and 30 mL separately.
Figure 5
Figure 5
Brain Imaging of Case 5. (A) acute CTA shows on the whole right MCA territory with decreased CBV and CBF, and prolonged MTT and DT. By adding up whole brain lesion volumes, core (red area) results a volume of 116mL, and penumbra (green are) has a volume of 110 mL. (B) acute CTA reveals occlusion of the M1 segment of right MCA (blue arrow). (C) Follow-up CTA reveals the recanalization of right MCA. (D) Follow-up NCCT shows a big infarct (consistent with baseline core maps), with midline shift to the left. Inside of the lesion, there is hemorrhagic transformation (white arrow).
Figure 6
Figure 6
Acute DWI (A) and CTP (B) of Case 6. DWI, performed after CTP, reveals a lacunar infarct on right thalamus (yellow circle). In that area, MTT and DT are prolonged. However, outside the yellow circle, there are small areas with prolonged MTT and DT too. These are noise, but are less on the DT map. On CBF and CBV maps, it is not possible to distinguish low signal in normal white matter from the lacunar perfusion lesion.
Figure 7
Figure 7
Cerebellum Images of Case 7. Acute CTA shows, compared to normal left side, right superior cerebellar artery (SCA) is absent. No obvious change is observed on acute NCCT. CTP reveals hypoperfused lesion on SCA territory with the existence of penumbra (green area). After treatment, DWI shows stroke lesion (high signal) corresponding to infarct core of CTP (red area) with at least some of the penumbra saved.
Figure 8
Figure 8
Cerebral Images of Case 8. (A) Acute CTP shows decreased CBF and DT on left MCA territory due to occlusion of M2 segment (blue arrow). (B) 24-hour CTP shows CBF and DT returns to normal level due to recanalization of occluded artery. (C, D) 24-hour NCCT and 24-hour DWI confirm that cerebral tissues are infarcted in reperfused area (red circle).
Figure 9
Figure 9
Cerebral images of Case 9. (A) acute DT map shows no specific perfusion lesion. (B) acute CTP source image shows hypodensity in the right lentiform (blue arrow). (C) follow-up DWI confirms the existence of ischemic lesion in the posterior right lentiform nucleus.

References

    1. Ito H, Kanno I, Kato C, Sasaki T, Ishii K, Ouchi Y, et al. Database of normal human cerebral blood flow, cerebral blood volume, cerebral oxygen extraction fraction and cerebral metabolic rate of oxygen measured by positron emission tomography with 15O-labelled carbon dioxide or water, carbon monoxide and oxygen: a multicentre study in Japan. Eur J Nucl Med Mol Imaging. 2004;31:635–643. - PubMed
    1. Konstas AA, Goldmakher GV, Lee TY, Lev MH. Theoretic basis and technical implementations of CT perfusion in acute ischemic stroke, part 1: theoretic basis. AJNR Am J Neuroradiol. 2009;30:662–668. - PMC - PubMed
    1. Bivard A, Spratt N, Levi C, Parsons M. Perfusion computer tomography: imaging and clinical validation in acute ischaemic stroke. Brain. 2011;134:3408–3416. - PubMed
    1. Bivard A, Levi C, Spratt N, Parsons M. Perfusion CT in acute stroke: a comprehensive analysis of infarct and penumbra. Radiology. 2013;267:543–550. - PubMed
    1. Bivard A, McElduff P, Spratt N, Levi C, Parsons M. Defining the extent of irreversible brain ischemia using perfusion computed tomography. Cerebrovasc Dis. 2011;31:238–245. - PubMed

LinkOut - more resources