. 2014 May 15;23(10):1121-33.
doi: 10.1089/scd.2013.0397. Epub 2014 Mar 3.

GSK3β, but not GSK3α, inhibits the neuronal differentiation of neural progenitor cells as a downstream target of mammalian target of rapamycin complex1

Affiliations

GSK3β, but not GSK3α, inhibits the neuronal differentiation of neural progenitor cells as a downstream target of mammalian target of rapamycin complex1

Jyhyun Ahn et al. Stem Cells Dev. .

Abstract

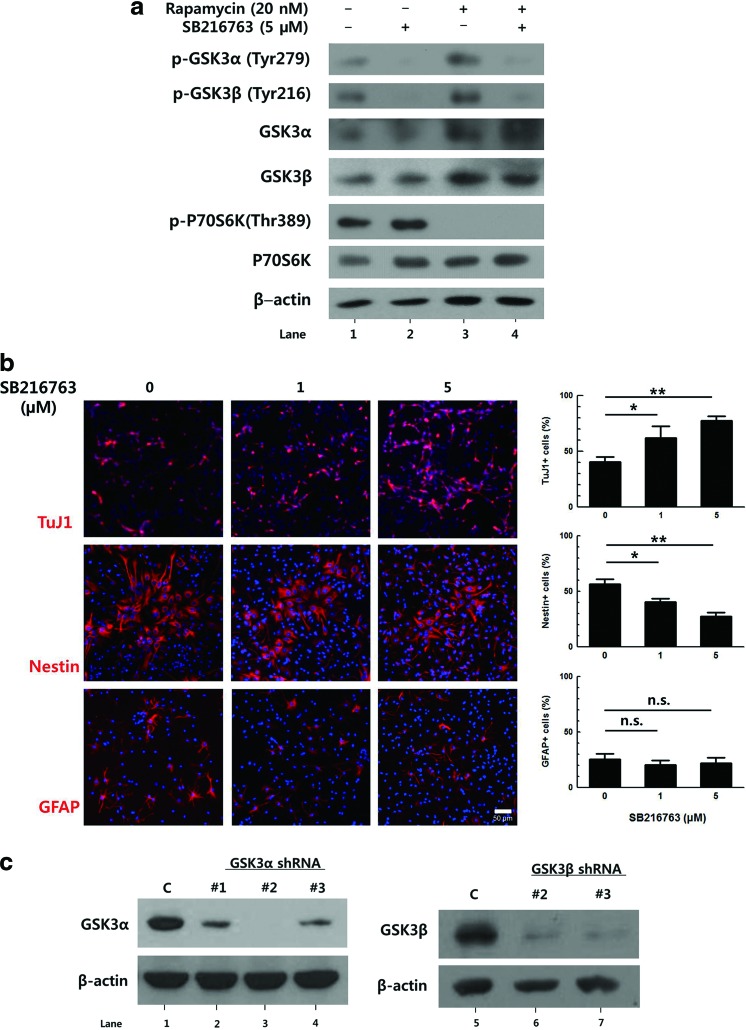
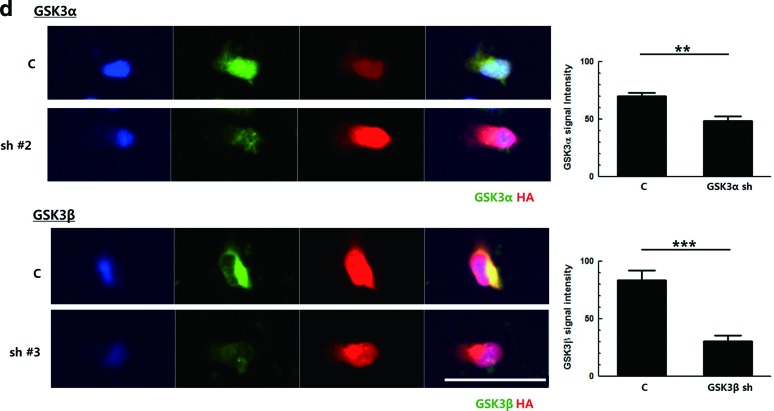
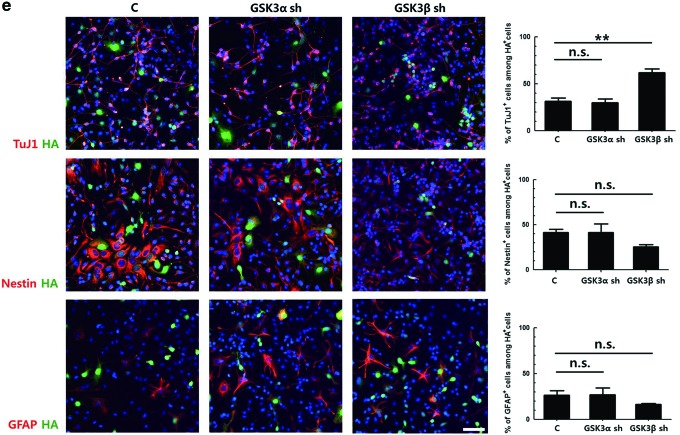
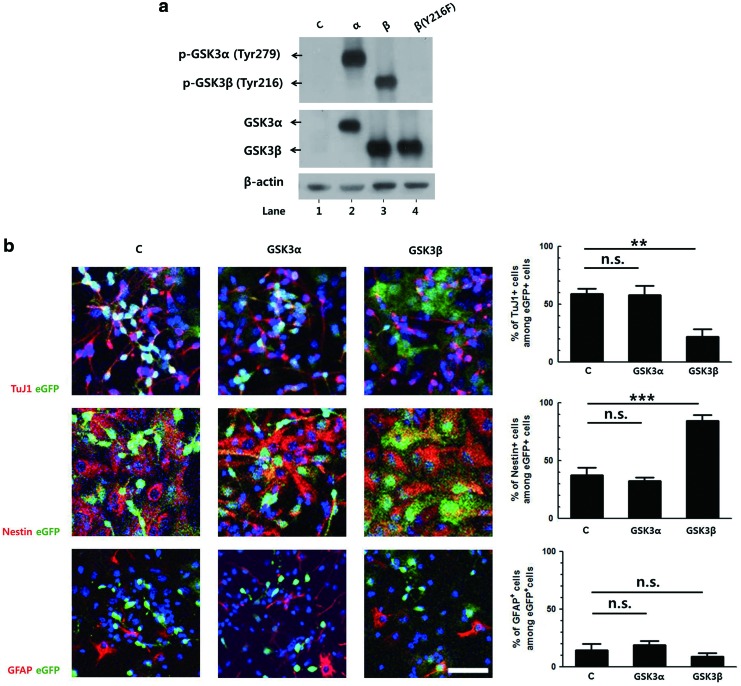
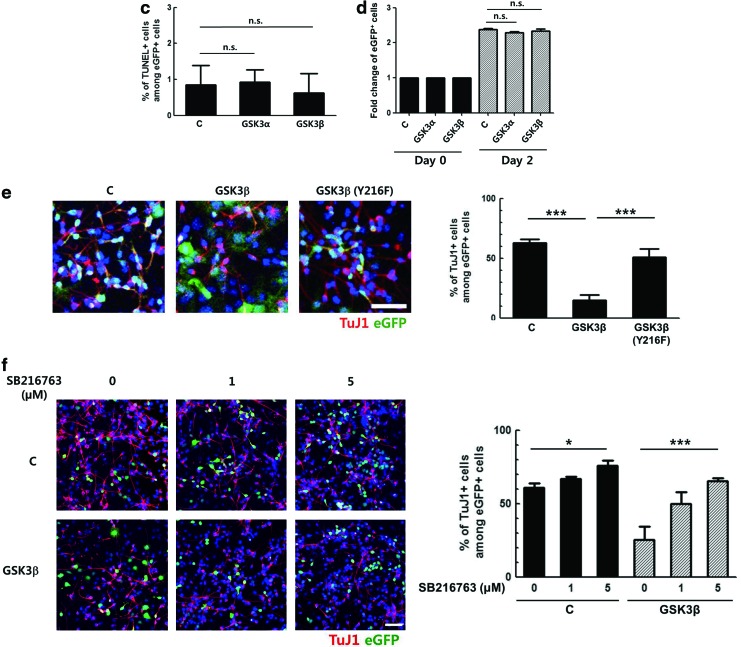
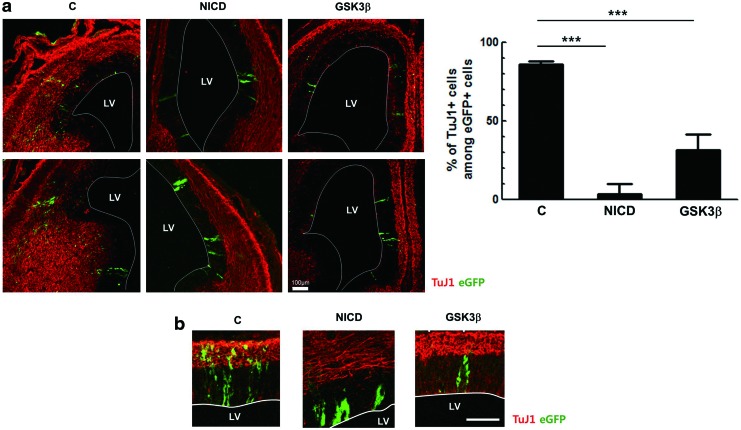
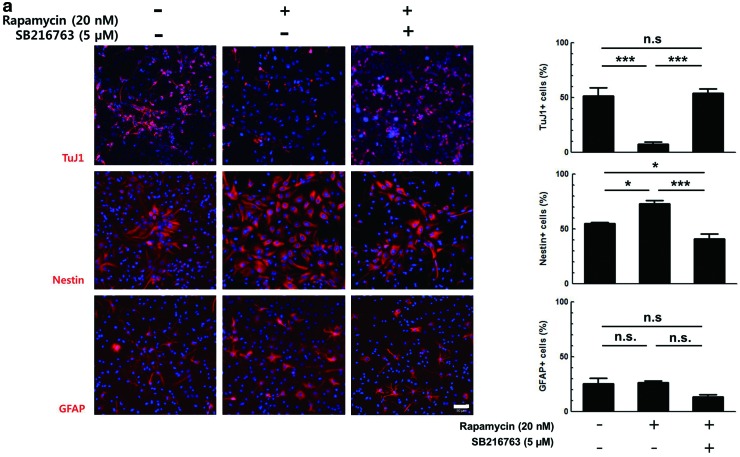
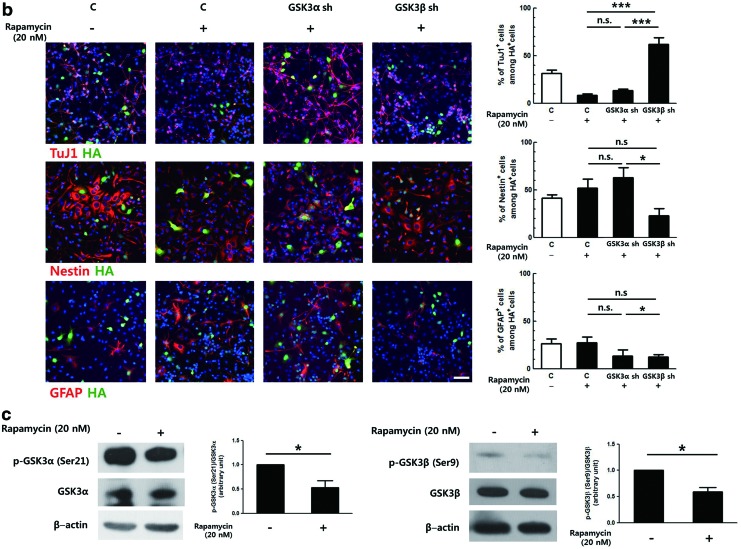
Glycogen synthase kinase 3 (GSK3) acts as an important regulator during the proliferation and differentiation of neural progenitor cells (NPCs), but the roles of the isoforms of this molecule (GSK3α and GSK3β) have not been clearly defined. In this study, we investigated the functions of GSK3α and GSK3β in the context of neuronal differentiation of murine NPCs. Treatment of primary NPCs with a GSK3 inhibitor (SB216763) resulted in an increase in the percentage of TuJ1-positive immature neurons, suggesting an inhibitory role of GSK3 in embryonic neurogenesis. Downregulation of GSK3β expression increased the percentage of TuJ1-positive cells, while knock-down of GSK3α seemed to have no effect. When primary NPCs were engineered to stably express either isoform of GSK3 using retroviral vectors, GSK3β, but not GSK3α, inhibited neuronal differentiation and helped the cells to maintain the characteristics of NPCs. Mutant GSK3β (Y216F) failed to suppress neuronal differentiation, indicating that the kinase activity of GSK3β is important for this regulatory function. Similar results were obtained in vivo when a retroviral vector expressing GSK3β was delivered to E9.5 mouse brains using the ultrasound image-guided gene delivery technique. In addition, SB216763 was found to block the rapamycin-mediated inhibition of neuronal differentiation of NPCs. Taken together, our results demonstrate that GSK3β, but not GSK3α, negatively controls the neuronal differentiation of progenitor cells and that GSK3β may act downstream of the mammalian target of rapamycin complex1 signaling pathway.


Figures

<b>FIG. 1.</b>
FIG. 1.
Downregulation of glycogen synthase kinase 3 (GSK3)β, but not GSK3α, increases the neuronal differentiation of primary neural progenitor cells (NPCs). (a) Primary NPCs were induced to differentiate in the presence of 5 μM SB216763 and 20 nM rapamycin, separately or together, for 3 h. Total cellular proteins were prepared and subjected to western blot. All proteins were analyzed using the same blot. (b) Primary NPCs were induced to differentiate with Dulbecco's modified Eagle's medium containing 2% fetal bovine serum in the presence of SB216763 for 3 days, followed by immunostaining for TuJ1, Nestin, and GFAP. Representative images of the staining and the percentages of each cell types are shown. (c) GSK3α-overexpressing NIH3T3 cells and NIH3T3 cells were transduced with retroviral vectors expressing GSK3α shRNA and GSK3β shRNA, respectively. The knockdown efficiency of each shRNA sequence was analyzed by western blot, using antibodies to GSK3α and GSK3β. (d) Primary NPCs were transduced with retroviral vectors expressing GSK3α shRNA No. 2 and GSK3β shRNA No. 3 for 2 days. The knockdown efficiency of each shRNA sequence was confirmed by immunostaining, using antibodies to HA tag with GSK3α or GSK3β. The signal intensity of GSK3α or GSK3β was quantified by ZEN 2012 (blue edition) software. (e) Primary NPCs were transduced with the same titer of respective retroviral vectors and then induced to differentiate for 2 days, followed by immunostaining for HA tag with TuJ1, Nestin, or GFAP. Representative images of the staining and the percentages of each cell types among HA-positive cells are shown. DNA was labeled with Hoechst 33258. Scale bar, 50 μm. *P<0.05; **P<0.01; ***P<0.001; n.s., not significant; C, control. Color images available online at www.liebertpub.com/scd
<b>FIG. 2.</b>
FIG. 2.
GSK3β, but not GSK3α, suppresses the neuronal differentiation of NPCs. (a) Retroviral vectors expressing GSK3α, GSK3β, or GSK3β (Y216F), together with eGFP, were used to transduce NIH3T3 cells. The level of expression and tyrosine phosphorylation of GSK3α, GSK3β, or GSK3β (Y216F) was analyzed by western blot, using specific antibodies. (b) Primary NPCs were transduced with the same titer of respective retroviral vectors and then induced to differentiate for 3 days. The cells were subjected to immunostaining for eGFP and TuJ1, Nestin, or GFAP. Representative images of the staining and the percentages of each cell types among eGFP-positive cells are shown. (c) Two days after the transduction of primary NPCs with the above retroviral vectors, they were subjected to differentiate for 3 days, and apoptotic cell death was analyzed by a TUNEL assay. (d) Two days after the transduction of primary NPCs with above retroviral vectors, the % of GFP+ cells were analyzed by fluorescence-activated cell sorting for 2 days. (e) Retroviral vectors expressing wild-type GSK3β or mutant GSK3β (Y216F) were used to transduce primary NPCs, followed by differentiation for 3 days. Representative images of eGFP and TuJ1 staining are shown. (f ) Primary NPCs were transduced with a retroviral vector expressing GSK3β, and then induced to differentiate for 3 days in the presence of SB216763. The cells were double labeled with antibodies to eGFP and TuJ1. The percentages of TuJ1-postive cells among eGFP-positive cells are presented. DNA was labeled with Hoechst 33258. Scale bar, 50 μm. *P<0.05; **P<0.01; ***P<0.001; n.s., not significant; C, control. Color images available online at www.liebertpub.com/scd
<b>FIG. 3.</b>
FIG. 3.
GSK3β inhibits neuronal differentiation in vivo. Retroviral vectors expressing Notch1 intracellular domain (NICD) or GSK3β, together with eGFP, were injected into E9.5 embryonic brains (n=3/group), and then the brains were immunostained with antibodies to eGFP and TuJ1 at E14.5. (a) Representative images of sections from two embryonic brains are shown. Among eGFP-positive cells, the number of TuJ1-positive cells was counted in coronal sections through the lateral ventricle (LV). Results from the cell counting are shown. (b) Enlarged images. Scale bar, 100 μm. ***P<0.001; C, control. Color images available online at www.liebertpub.com/scd
<b>FIG. 4.</b>
FIG. 4.
Mammalian target of rapamycin complex1 (mTORC1) inhibits GSK3β by serine9 phosphorylation. (a) Differentiated primary NPCs in the presence of 5 μM SB216763 and 20 nM rapamycin, separately or together, were immunostained using antibodies to TuJ1, Nestin, and GFAP. Representative images of the staining and the results from the cell counting are shown. (b) Primary NPCs were transduced with retroviral vectors expressing control shRNA, GSK3α shRNA or GSK3β shRNA for 2 days, followed by differentiation with or without rapamycin for 2 days. Cells were immunostained for HA tag with TuJ1, Nestin, or GFAP. Representative images of the staining and the percentages of each cell types among HA-positive cells are shown. (c) Proteins from the primary NPCs induced to differentiate in the presence of rapamycin for 24 h were prepared and subjected to western blot using antibodies to p-GSK3α (Ser21) and p-GSK3β (Ser9). The band intensity was quantified by Image J software. DNA was labeled with Hoechst 33258. Scale bar, 50 μm. *P<0.05; ***P<0.001; n.s., not significant; C, control. Color images available online at www.liebertpub.com/scd

Similar articles

Cited by

References

    1. Forde JE. and Dale TC. (2007). Glycogen synthase kinase 3: a key regulator of cellular fate. Cell Mol Life Sci 64:1930–1944 - PMC - PubMed
    1. Woodgett JR. (1990). Molecular-cloning and expression of glycogen-synthase kinase-3 factor-A. EMBO J 9:2431–2438 - PMC - PubMed
    1. Hur EM. and Zhou FQ. (2010). GSK3 signalling in neural development. Nat Rev Neurosci 11:539–551 - PMC - PubMed
    1. Kim WY, Zhou FQ, Zhou J, Yokota Y, Wang YM, Yoshimura T, Kaibuchi K, Woodgett JR, Anton ES. and Snider WD. (2006). Essential roles for GSK-3s and GSK-3-primed substrates in neurotrophin-induced and hippocampal axon growth. Neuron 52:981–996 - PMC - PubMed
    1. Kim WY, Wang X, Wu Y, Doble BW, Patel S, Woodgett JR. and Snider WD. (2009). GSK-3 is a master regulator of neural progenitor homeostasis. Nat Neurosci 12:1390–1397 - PMC - PubMed

Publication types

MeSH terms