Comparative Study
. 2014 Feb 4;55(2):674-87.
doi: 10.1167/iovs.13-12811.

Evaluation of retinal nerve fiber layer thickness and axonal transport 1 and 2 weeks after 8 hours of acute intraocular pressure elevation in rats

Affiliations
Comparative Study

Evaluation of retinal nerve fiber layer thickness and axonal transport 1 and 2 weeks after 8 hours of acute intraocular pressure elevation in rats

Carla J Abbott et al. Invest Ophthalmol Vis Sci. .

Abstract

Purpose: To compare in vivo retinal nerve fiber layer thickness (RNFLT) and axonal transport at 1 and 2 weeks after an 8-hour acute IOP elevation in rats.

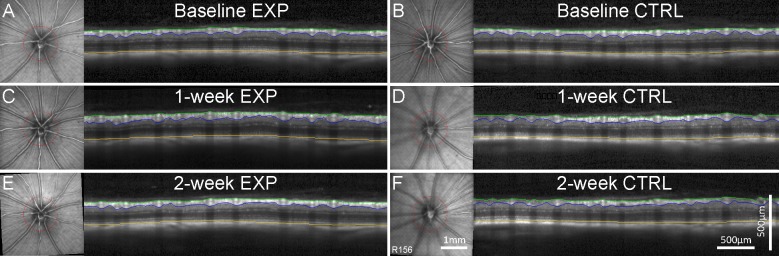
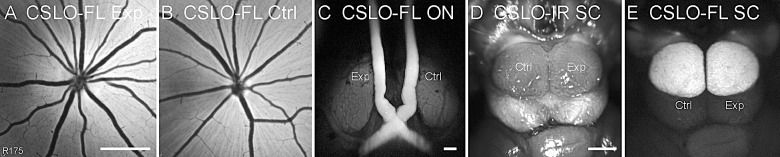
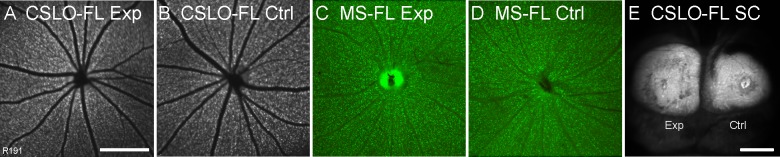
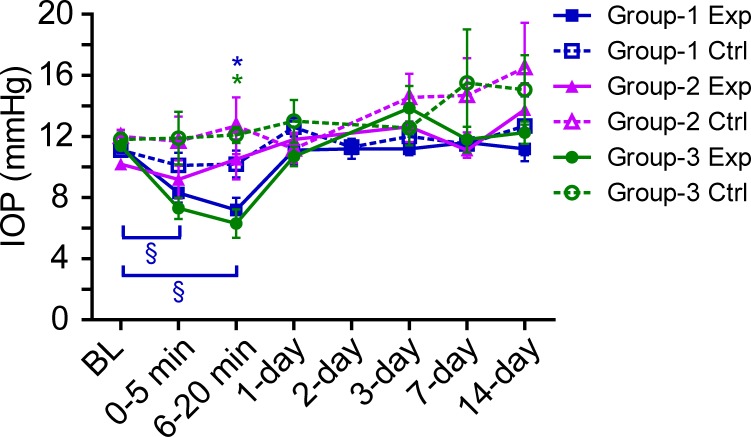
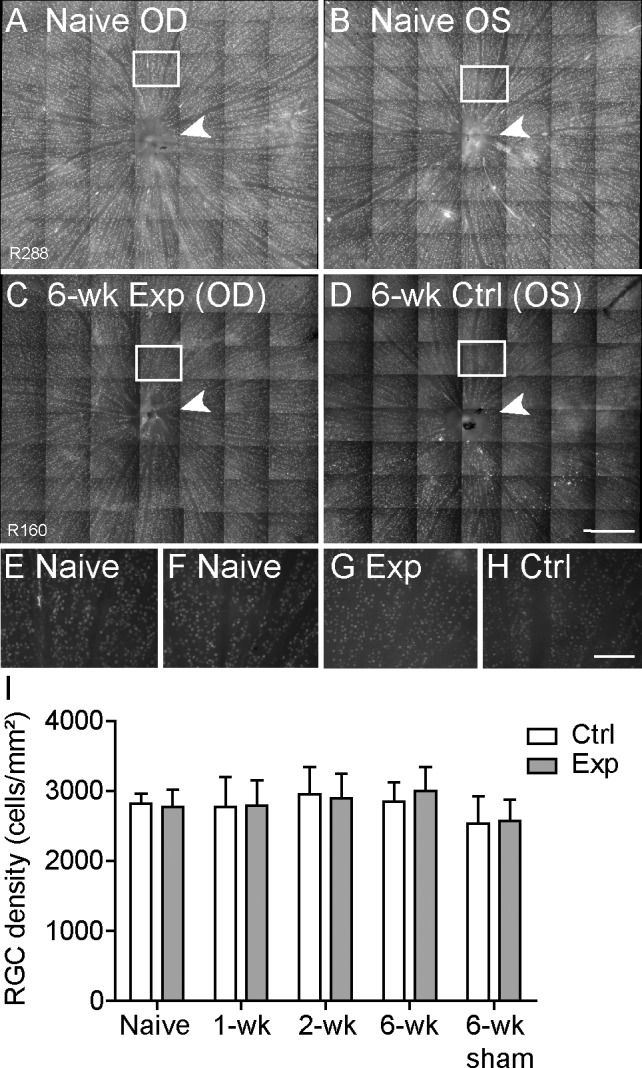
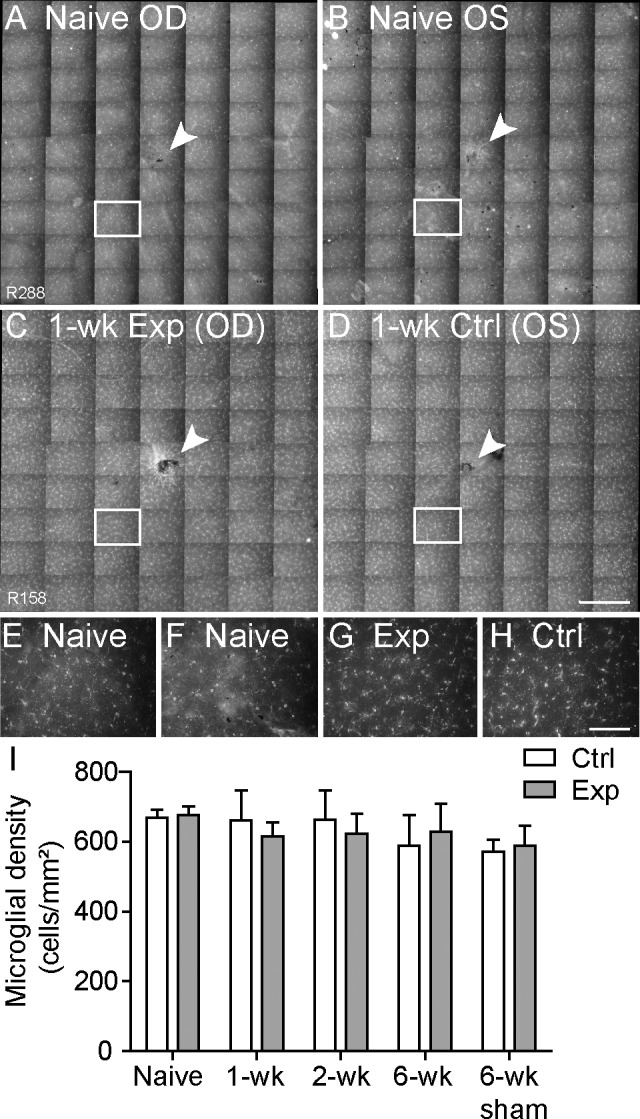
Methods: Forty-seven adult male Brown Norway rats were used. Procedures were performed under anesthesia. The IOP was manometrically elevated to 50 mm Hg or held at 15 mm Hg (sham) for 8 hours unilaterally. The RNFLT was measured by spectral-domain optical coherence tomography. Anterograde and retrograde axonal transport was assessed from confocal scanning laser ophthalmoscopy imaging 24 hours after bilateral injections of 2 μL 1% cholera toxin B-subunit conjugated to AlexaFluor 488 into the vitreous or superior colliculi, respectively. Retinal ganglion cell (RGC) and microglial densities were determined using antibodies against Brn3a and Iba-1.

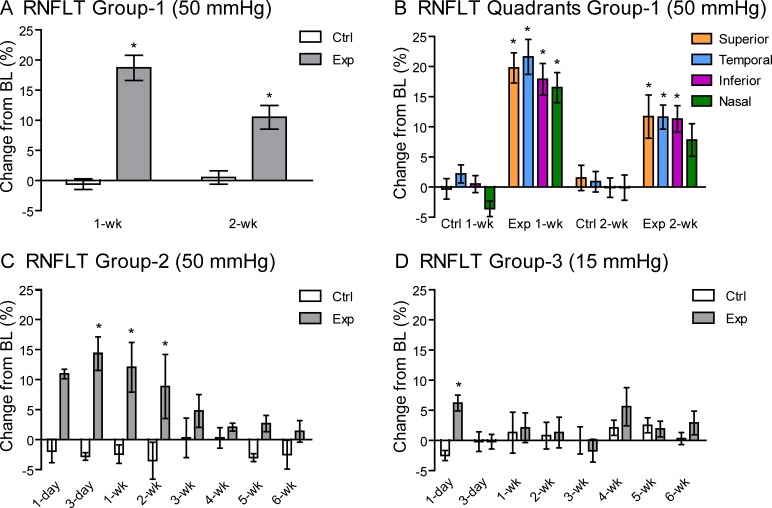
Results: The RNFLT in experimental eyes increased from baseline by 11% at 1 day (P < 0.001), peaked at 19% at 1 week (P < 0.0001), remained 11% thicker at 2 weeks (P < 0.001), recovered at 3 weeks (P > 0.05), and showed no sign of thinning at 6 weeks (P > 0.05). There was no disruption of anterograde transport at 1 week (superior colliculi fluorescence intensity, 75.3 ± 7.9 arbitrary units [AU] for the experimental eyes and 77.1 ± 6.7 AU for the control eyes) (P = 0.438) or 2 weeks (P = 0.188). There was no obstruction of retrograde transport at 1 week (RCG density, 1651 ± 153 per mm(2) for the experimental eyes and 1615 ± 135 per mm(2) for the control eyes) (P = 0.63) or 2 weeks (P = 0.25). There was no loss of Brn3a-positive RGC density at 6 weeks (P = 0.74) and no increase in microglial density (P = 0.92).

Conclusions: Acute IOP elevation to 50 mm Hg for 8 hours does not cause a persisting axonal transport deficit at 1 or 2 weeks or a detectable RNFLT or RGC loss by 6 weeks but does lead to transient RNFL thickening that resolves by 3 weeks.

Keywords: axonal transport; confocal scanning laser ophthalmoscope; glaucoma; optical coherence tomography; retinal ganglion cell; retinal nerve fiber layer.


Figures

Figure 1
Figure 1
Longitudinal measurements of RNFLT and RT obtained by SD-OCT are shown for a single representative rat at baseline (A, B) and at 1 week (C, D) and 2 weeks (E, F) after acute, unilateral IOP elevation to 50 mm Hg for 8 hours. Data from the experimental eye (Exp) appear in the left column and from the fellow control eye (Ctrl) in the right column. In each panel, the SD-OCT B-scan is shown alongside the infrared ocular fundus CSLO image. The B-scan position is indicated by the red circle in the CSLO image and is maintained at follow-up with eye tracking software. B-scan images show the segmentations of the inner limiting membrane (green), outer border of the nerve fiber layer (blue), and Bruch's membrane–RPE complex (yellow), used to calculate peripapillary RNFLT (green to blue) and RT (green to yellow). The RNFLT increased at the 1-week and 2-week follow-up (C, E) compared with baseline (A) for the experimental eye, while the fellow control eye remains consistent (B, D, F). Scale bars apply to (A) through (F).
Figure 2
Figure 2
Percentage change in RNFLT at follow-up time points relative to baseline (BL) for each group of experimental (Exp) and fellow control (Ctrl) eyes. (A) Group 1 (50 mm Hg) rats show an increase in RNFLT at both the 1-week (n = 28) and 2-week (n = 15) follow-up in the experimental eyes but not in their fellow control eyes. (B) The change in peripapillary RNFLT for group 1 eyes from baseline was similar across superior, temporal, inferior, and nasal quadrants at both the 1-week (P = 0.11) and 2-week (P = 0.62) follow-up. (C) Data from group 2 with a 6-week follow-up (50 mm Hg [n = 4]) show that the increase in RNFLT is transient, recovering to baseline by the 3-week follow-up, with a peak observed at 3 days and no loss evident at 6 weeks. (D) Data from group 3 with a 6-week follow-up (sham, 15 mm Hg [n = 4]) show a smaller, transient increase in RNFLT in the experimental eyes at the 1-day follow-up only. Error bars denote ±SEM. *P < 0.05 (Bonferroni post hoc test).
Figure 3
Figure 3
Results of the anterograde axonal transport assay 1 week after acute IOP elevation to 50 mm Hg for 8 hours in the experimental eye in one representative animal. (A, B) The CSLO-FL images of the ocular fundi obtained in vivo from the experimental (Exp [A]) and control (Ctrl [B]) eyes 24 hours after bilateral intravitreal injections of CTB demonstrate successful CTB uptake and transport by RGCs along their axons to the optic disc. (C) Postmortem CSLO-FL of the optic nerves and chiasm shows equivalent fluorescence along both nerves, indicating intact anterograde axonal transport along experimental and control pathways of the optic nerve. (D) Postmortem CSLO infrared (IR) image of the dorsal midbrain shows the position of the superior colliculi for orientation. (E) Postmortem CSLO-FL image of the superior colliculi shows equivalent intensity and coverage of CTB fluorescence between colliculi, indicating that anterograde axonal transport to the colliculi is intact along both experimental and control pathways. Quantitative results are summarized in Table 2. Scale bars: 1 mm (A applies to A and B; D applies to D and E).
Figure 4
Figure 4
Results of the retrograde axonal transport assay 2 weeks after the 8-hour episode of acute IOP elevation to 50 mm Hg in the experimental eye in one representative animal. (A, B) In vivo CSLO-FL images of the experimental (A) and fellow control (B) ocular fundi showing equivalent fluorescence (intensity and density) of RGC somas 24 hours after bilateral injections of CTB into the superior colliculi. (C, D) Postmortem fluorescence microscopy (MS-FL) of experimental (C) and fellow control (D) retinal whole mounts also shows equivalent fluorescence between eyes. The fluorescence of the RGCs is similar between the CSLO and microscopy images, although the optic disc is usually brighter in the microscopy image. Note that the disc in (D) has been partially removed during the retina dissection, so it is not as bright as the disc in C. These results indicate uninterrupted retrograde axonal transport of CTB along experimental and control pathways. Quantitative results are summarized in Table 3. (E) Postmortem CSLO-FL image of the superior colliculi shows that CTB injections were successful. Scale bars: 1 mm (A applies to AD).
Figure 5
Figure 5
The IOP of experimental (Exp) and fellow control (Ctrl) eyes under general anesthesia at baseline immediately before cannulation (BL), at 0 to 5 minutes and 6 to 20 minutes after cannula removal, and at the 1-day, 2-day, 3-day, 7-day, and 14-day follow-up. Data are shown for group 1 (n = 15) and group 2 (n = 4), which both had IOP elevation to 50 mm Hg for 8 hours, and for group 3 (n = 4, sham), which had IOP held at 15 mm Hg for 8 hours. The IOP in the experimental eyes decreased immediately after cannula removal but recovered relative to baseline and fellow control by the 1-day follow-up. Error bars = SEM. *P < 0.05 in experimental eyes compared with fellow control at that time point. §P < 0.05 in experimental eyes compared with baseline (Bonferroni post hoc test).
Figure 6
Figure 6
Density of Brn3a-labeled RGCs across 8.1 ± 1.0 mm2 of central retina. (AD) Representative example of RGC somas seen in a montage of micrographs (×20) from right (A) and left (B) naive normal retinas and in experimental (C) and fellow control (D) retinas from a group 2 rat sacrificed 6 weeks after the IOP elevation episode. Arrowheads indicate the optic disc. (EH) Higher-resolution micrographs from boxed regions in (AD) are shown in (EH), respectively. (I) Quantification of RGC density for experimental (Exp) and fellow control (Ctrl) eyes from rats sacrificed 1 and 2 weeks (group 1 [n = 9 and n = 11, respectively]) and 6 weeks (group 2 [n = 4]) after IOP elevation to 50 mm Hg for 8 hours, along with rats sacrificed 6 weeks (group 3 [n = 4]) after sham cannulation to 15 mm Hg for 8 hours and naive normal rats (group 4 [n = 5]). There was no loss of RGCs in experimental eyes relative to fellow control eyes (P = 0.74) or between groups (P = 0.34). Error bars = SEM. Scale bars: 0.5 mm (AD); 100 μm (EH).
Figure 7
Figure 7
Density of Iba-1–labeled microglia within the RNFL across 7.6 ± 1.8 mm2 of central retina. (AD) Representative example of microglia seen in a montage of micrographs from right (A) and left (B) naive normal retinas and experimental (Exp [C]) and fellow control (Ctrl [D]) retinas from a rat sacrificed 1 week after IOP elevation, which correlates with the peak RNFL thickening seen in group 1 and group 2 experimental eyes. Arrowheads indicate the optic disc. (EH) Higher-resolution micrographs from boxed regions in A through D are shown in E through H, respectively. The shape and density of microglia appear similar between retinas, indicating no activation of microglia in experimental eyes. (I) Quantification of RNFL microglia density for experimental and fellow control eyes sacrificed at 1 and 2 weeks (group 1 [n = 4 each]) and 6 weeks (group 2 [n = 4]) after IOP elevation to 50 mm Hg for 8 hours, along with rats sacrificed 6 weeks (group 3 [n = 4]) after sham cannulation to 15 mm Hg for 8 hours and naive normal rats (group 4 [n = 5]). Microglial density was equivalent between experimental relative to fellow control eyes (P = 0.92) and in experimental and sham groups relative to the naive normal group (P > 0.05 for all). This indicates that microglial activation is not responsible for RNFL thickening. Error bars = SEM. Scale bars: 0.5 mm (applies to AD); 100 μm (applies to EH).

References

    1. Quigley HA. Neuronal death in glaucoma. Prog Retin Eye Res. 1999; 18: 39–57 - PubMed
    1. Weinreb RN, Khaw PT. Primary open-angle glaucoma. Lancet. 2004; 363: 1711–1720 - PubMed
    1. Danesh-Meyer HV, Boland MV, Savino PJ, et al. Optic disc morphology in open-angle glaucoma compared with anterior ischemic optic neuropathies. Invest Ophthalmol Vis Sci. 2010; 51: 2003–2010 - PMC - PubMed
    1. Emery JM, Landis D, Paton D, Boniuk M, Craig JM. The lamina cribrosa in normal and glaucomatous human eyes. Trans Am Acad Ophthalmol Otolaryngol. 1973; 78: OP290–OP297 - PubMed
    1. Vrabec F. Glaucomatous cupping of the human optic disk. Arch Klin Exp Ophthalmol. 1976; 198: 223–234 - PubMed

Publication types

MeSH terms

Substances