. 2014 Jan 8:7:10.
doi: 10.1186/1756-3305-7-10.

Control of tick infestations and pathogen prevalence in cattle and sheep farms vaccinated with the recombinant Subolesin-Major Surface Protein 1a chimeric antigen

Affiliations

Control of tick infestations and pathogen prevalence in cattle and sheep farms vaccinated with the recombinant Subolesin-Major Surface Protein 1a chimeric antigen

Alessandra Torina et al. Parasit Vectors. .

Abstract

Background: Despite the use of chemical acaricides, tick infestations continue to affect animal health and production worldwide. Tick vaccines have been proposed as a cost-effective and environmentally friendly alternative for tick control. Vaccination with the candidate tick protective antigen, Subolesin (SUB), has been shown experimentally to be effective in controlling vector infestations and pathogen infection. Furthermore, Escherichia coli membranes containing the chimeric antigen composed of SUB fused to Anaplasma marginale Major Surface Protein 1a (MSP1a) (SUB-MSP1a) were produced using a simple low-cost process and proved to be effective for the control of cattle tick, Rhipicephalus (Boophilus) microplus and R. annulatus infestations in pen trials. In this research, field trials were conducted to characterize the effect of vaccination with SUB-MSP1a on tick infestations and the prevalence of tick-borne pathogens in a randomized controlled prospective study.

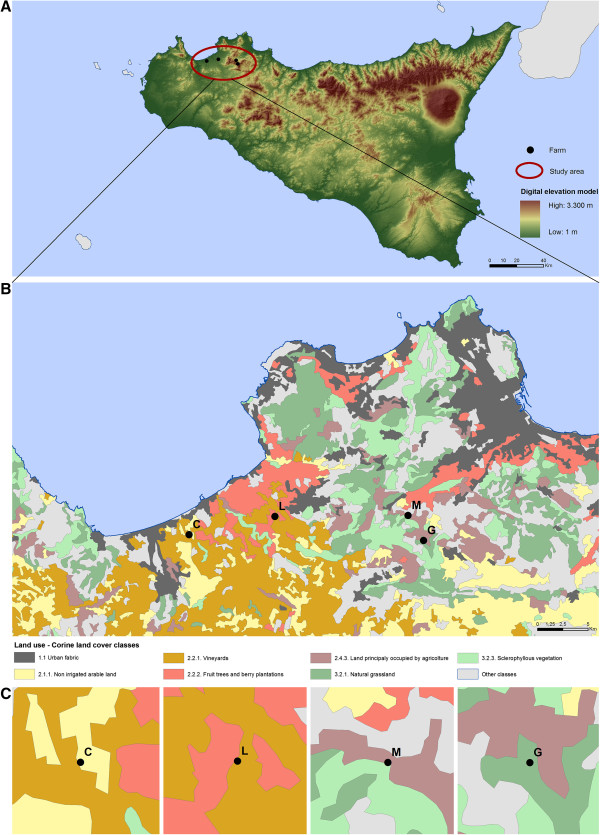
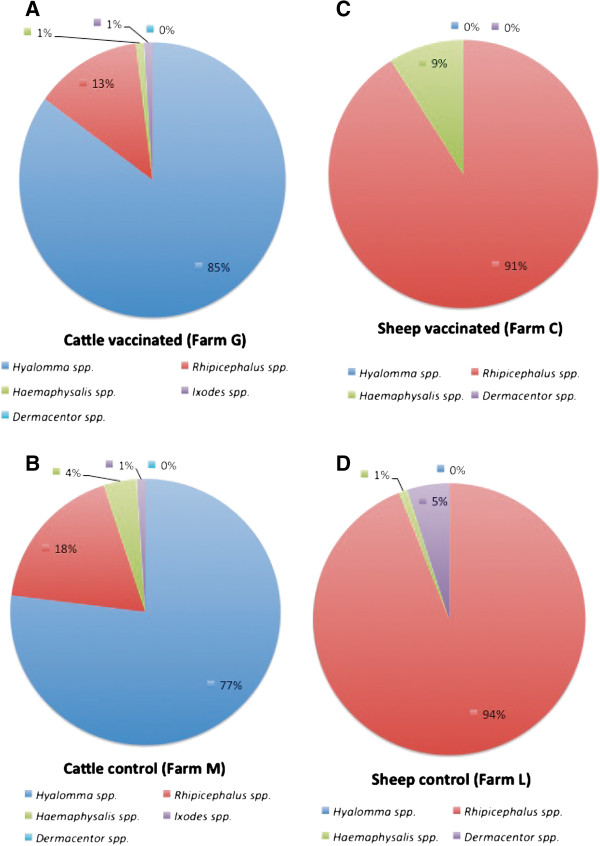
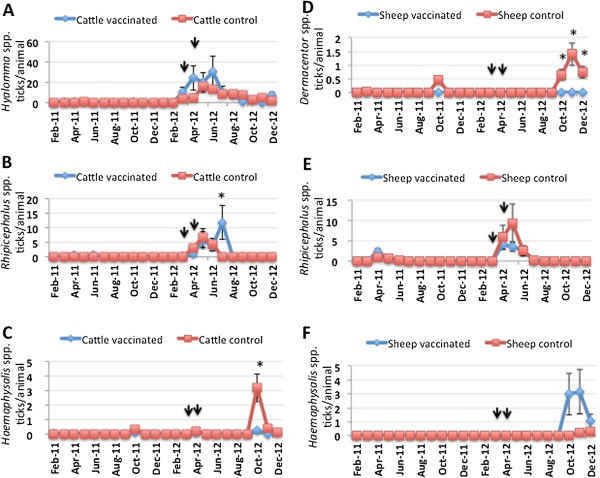
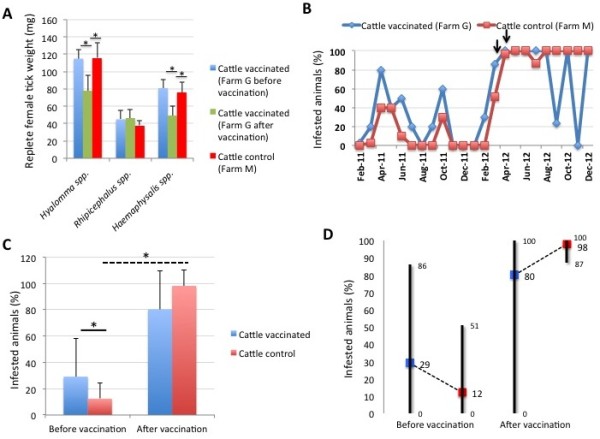
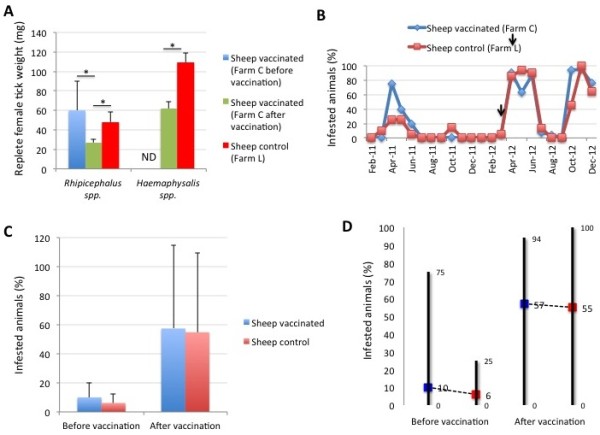
Methods: Two cattle and two sheep farms with similar geographical locations and production characteristics were randomly assigned to control and vaccinated groups. Ticks were collected, counted, weighed and classified and the prevalence of tick-borne pathogens at the DNA and serological levels were followed for one year prior to and 9 months after vaccination.

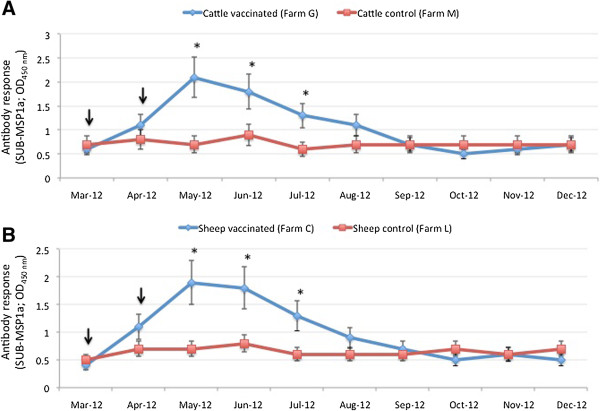
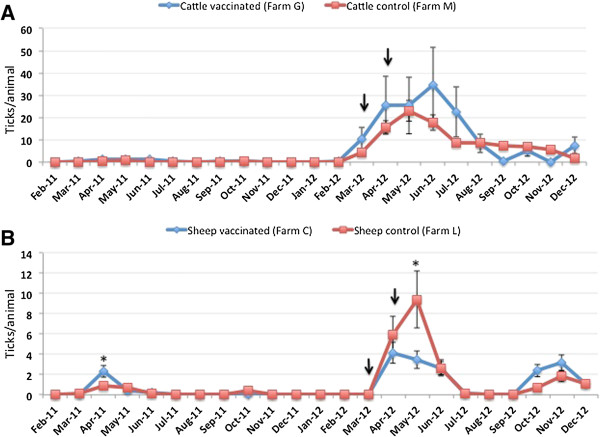
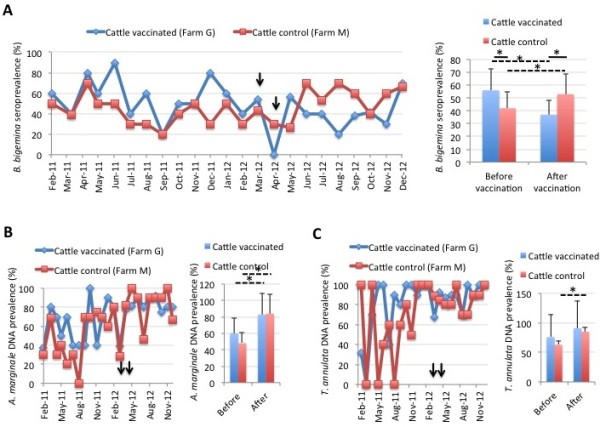
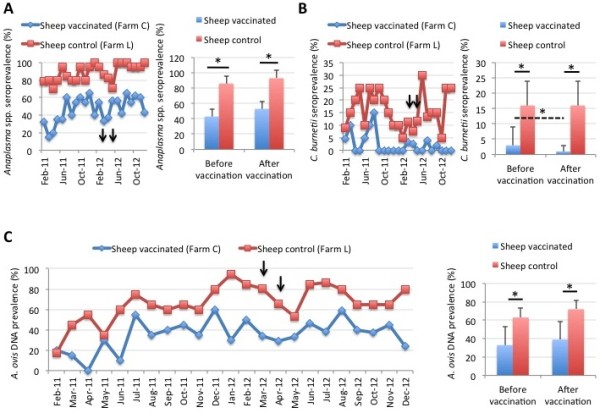
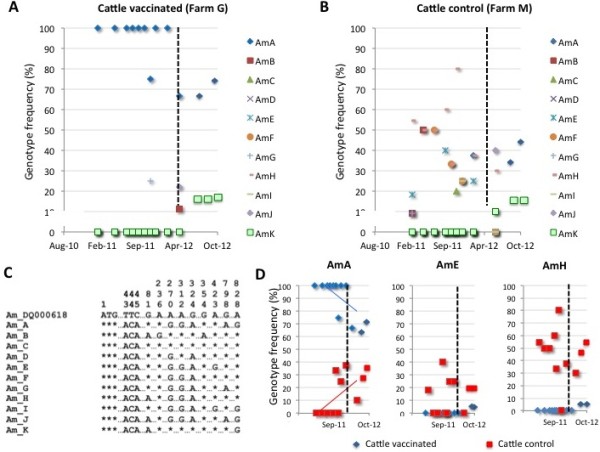
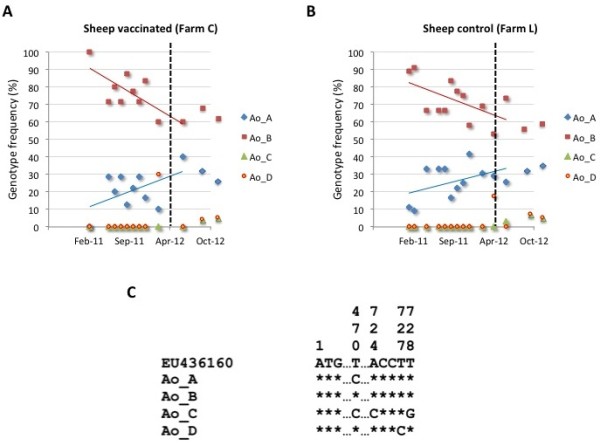
Results: Both cattle and sheep developed antibodies against SUB in response to vaccination. The main effect of the vaccine in cattle was the 8-fold reduction in the percent of infested animals while vaccination in sheep reduced tick infestations by 63%. Female tick weight was 32-55% lower in ticks collected from both vaccinated cattle and sheep when compared to controls. The seroprevalence of Babesia bigemina was lower by 30% in vaccinated cattle, suggesting a possible role for the vaccine in decreasing the prevalence of this tick-borne pathogen. The effect of the vaccine in reducing the frequency of one A. marginale msp4 genotype probably reflected the reduction in the prevalence of a tick-transmitted strain as a result of the reduction in the percent of tick-infested cattle.

Conclusions: These data provide evidence of the dual effect of a SUB-based vaccine for controlling tick infestations and pathogen infection/transmission and provide additional support for the use of the SUB-MSP1a vaccine for tick control in cattle and sheep.


Figures

Figure 1
Figure 1
Localization of cattle and sheep farms and land use in the study area. Maps were constructed using the Esri ArcMap 9.3 software. (A) Localization of the study area in the Province of Palermo, Sicily. The digital elevation model was processed through the interpolation of level curves values of the Sicilian region, obtaining the elevations of study sites. (B) The land use of the areas near to the farms was obtained from Corine Land Cover 2006 processed by the European Environmental Agency describing the coverage and, in part, the use of the soil in Europe. Spatial selection allowed deriving the different levels of the land use classes that affect the areas where the farms are placed. (C) The analysis showed that vaccinated and control sheep (L and C) and cattle (M and G) farms are located close to each other in the same region and have similar land use.
Figure 2
Figure 2
Antibody response in cattle and sheep. Serum antibody titers to the recombinant vaccine antigen, SUB-MSP1a, were determined by ELISA in (A) cattle and (B) sheep. Antibody titers were expressed as the OD450nm value for the 1:1000 serum dilution, represented as Ave ± SD and compared between vaccinated and control animals using an ANOVA test (*p < 0.05). The time of immunization shots are indicated with arrows.
Figure 3
Figure 3
Tick infestations in cattle and sheep. Ticks found on animals in both vaccinated and control (A) cattle and (B) sheep farms were counted and stored in 70% ethanol. Tick infestations (ticks/animal) were represented as Ave ± SD and compared between vaccinated and control animals using an ANOVA test (*p < 0.05). The time of immunization shots are indicated with arrows.
Figure 4
Figure 4
Tick species infesting cattle and sheep. Ticks collected from (A, B) cattle and (C, D) sheep in both (A, C) vaccinated and (B, D) control farms were classified, grouped according to tick genera and represented as percent of total ticks collected throughout the experiment.
Figure 5
Figure 5
Infestation with more abundant tick species in cattle and sheep. The most abundant tick species found on (A-C) cattle and (D-F) sheep were counted, represented as ticks per animal (Ave ± SD) and compared between vaccinated and control animals using an ANOVA test (*p < 0.05). The time of immunization shots are indicated with arrows.
Figure 6
Figure 6
Tick weight and percent infested cattle. (A) Replete female ticks collected from vaccinated and control cattle were weighed, the weight (mg) represented as Ave ± SD and compared between cattle in the vaccinated farm before and after vaccination and between vaccinated and control cattle by Student’s t-test with unequal variance (*p < 0.05). (B) Percent infested cattle in vaccinated and control farms. The time of immunization shots are indicated with arrows. (C) Percent infested cattle before and after vaccination with SUB-MSP1a was represented as Ave ± SD and compared between vaccinated and control cattle by Student’s t-test with unequal variance (*p < 0.05). (D) Range values for the percent infested cattle in vaccinated and control farms before and after vaccination. Average values are shown to illustrate differences between vaccinated and control animals.
Figure 7
Figure 7
Tick weight and percent infested sheep. (A) Replete female ticks collected from vaccinated and control sheep were weighed, the weight (mg) represented as Ave ± SD and compared between sheep in the vaccinated farm before and after vaccination and between vaccinated and control sheep by Student’s t-test with unequal variance (*p < 0.05). (B) Percent infested sheep in vaccinated and control farms. The time of immunization shots are indicated with arrows. (C) Percent infested sheep before and after vaccination with SUB-MSP1a was represented as Ave ± SD and compared between vaccinated and control sheep by Student’s t-test with unequal variance (*p < 0.05). (D) Range values for the percent infested sheep in vaccinated and control farms before and after vaccination. Average values are shown to illustrate differences between vaccinated and control animals.
Figure 8
Figure 8
Prevalence of tick-borne pathogens in cattle. (A) The seroprevalence (%) of B. bigemina in vaccinated and control cattle was determined by ELISA, represented as Ave ± SD and compared between cattle in the vaccinated farm before and after vaccination and between vaccinated and control cattle by Student’s t-test with unequal variance (*p < 0.05). The time of immunization shots are indicated with arrows. (B) The DNA prevalence (%) for A. marginale in vaccinated and control cattle was determined by PCR, represented as Ave ± SD and compared between cattle in the vaccinated farm before and after vaccination and between vaccinated and control cattle by Student’s t-test with unequal variance (*p < 0.05). The time of immunization shots are indicated with arrows. (C) The DNA prevalence (%) for T. annulata in vaccinated and control cattle was determined by PCR, represented as Ave ± SD and compared between cattle in the vaccinated farm before and after vaccination and between vaccinated and control cattle by Student’s t-test with unequal variance (*p < 0.05). The time of immunization shots are indicated with arrows.
Figure 9
Figure 9
Prevalence of tick-borne pathogens in sheep. (A) The seroprevalence (%) of Anaplasma spp. in vaccinated and control sheep was determined by ELISA, represented as Ave ± SD and compared between sheep in the vaccinated farm before and after vaccination and between vaccinated and control sheep by Student’s t-test with unequal variance (*p < 0.05). The time of immunization shots are indicated with arrows. (B) The seroprevalence (%) of C. burnetii in vaccinated and control sheep was determined by ELISA, represented as Ave ± SD and compared between sheep in the vaccinated farm before and after vaccination and between vaccinated and control sheep by Student’s t-test with unequal variance (*p < 0.05). The time of immunization shots are indicated with arrows. (C) The DNA prevalence (%) for A. ovis in vaccinated and control sheep was determined by PCR, represented as Ave ± SD and compared between sheep in the vaccinated farm before and after vaccination and between vaccinated and control sheep by Student’s t-test with unequal variance (*p < 0.05). The time of immunization shots are indicated with arrows.
Figure 10
Figure 10
Characterization of the A. marginale msp4 genotypes in cattle. The A. marginale msp4 coding region was amplified by PCR, sequenced and the frequency (%) for each genotype represented in (A) vaccinated and (B) control cattle. Dashed line represents time of last immunization shot. (C) The msp4 sequences of each genotype were aligned and compared to the reference sequence (GenBank accession number DQ000618). Sequence positions (the adenine in the translation initiation codon ATG corresponds to position 1) with polymorphisms were identified. Asterisks represent sequence positions identical to the reference sequence. (D) Distribution in the frequencies of the most abundant A. marginale msp4 genotypes in vaccinated and control cattle. Dashed line represents time of last immunization shot. A correlation analysis was conducted to analyze genotype frequencies in time using Excel and represented only when the correlation coefficient (R2) was ≥0.5.
Figure 11
Figure 11
Characterization of the A. ovis msp4 genotypes in sheep. The A. ovis msp4 coding region was amplified by PCR, sequenced and the frequency (%) for each genotype represented in (A) vaccinated and (B) control sheep. Dashed line represents time of last immunization shot. A correlation analysis was conducted to analyze genotype frequencies in time using Excel and represented only when the correlation coefficient (R2) was ≥0.5. (C) The msp4 sequences of each genotype were aligned and compared to the reference sequence (GenBank accession number EU436160). Sequence positions (the adenine in the translation initiation codon ATG corresponds to position 1) with polymorphisms were identified. Asterisks represent sequence positions identical to the reference sequence.

References

    1. de la Fuente J, Rodríguez M, Redondo M, Montero C, García-García JC, Méndez L, Serrano E, Valdés M, Enríquez A, Canales M, Ramos E, de Armas CA, Rey S, Rodríguez JL, Artiles M, García L. Field studies and cost-effectiveness analysis of vaccination with GavacTM against the cattle tick Boophilus microplus. Vaccine. 1998;16:366–373. doi: 10.1016/S0264-410X(97)00208-9. - DOI - PubMed
    1. de la Fuente J, Estrada-Peña A, Venzal JM, Kocan KM, Sonenshine DE. Overview: ticks as vectors of pathogens that cause disease in humans and animals. Front Biosci. 2008;13:6938–6946. - PubMed
    1. Caracappa S. Livestock production and animal health in Sicily, Italy. Parassitologia. 1999;41(Suppl. 1):17–23. - PubMed
    1. Graf JF, Gogolewski R, Leach-Bing N, Sabatini GA, Molento MB, Bordin EL, Arantes GJ. Tick control: an industry point of view. Parasitol. 2004;129:S427–S442. doi: 10.1017/S0031182004006079. - DOI - PubMed
    1. de la Fuente J, Kocan KM. Strategies for development of vaccines for control of ixodid tick species. Parasite Immunol. 2006;28:275–283. doi: 10.1111/j.1365-3024.2006.00828.x. - DOI - PubMed

Publication types

MeSH terms