Comparative Study
. 2014 Mar 7;289(10):6740-6750.
doi: 10.1074/jbc.M113.507707. Epub 2014 Jan 7.

Charge segregation and low hydrophobicity are key features of ribosomal proteins from different organisms

Affiliations
Comparative Study

Charge segregation and low hydrophobicity are key features of ribosomal proteins from different organisms

Daria V Fedyukina et al. J Biol Chem. .

Abstract

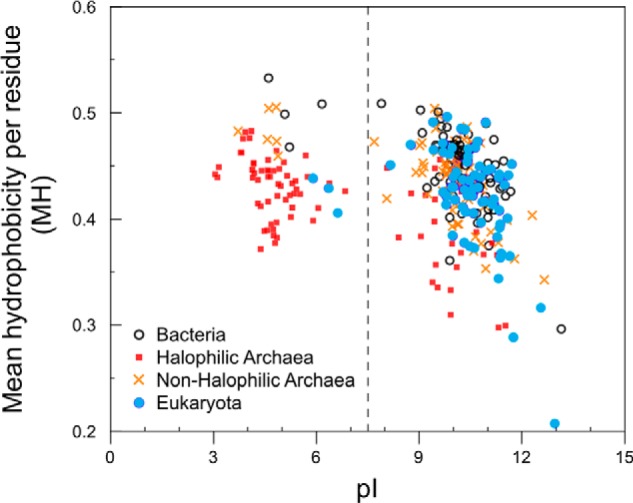
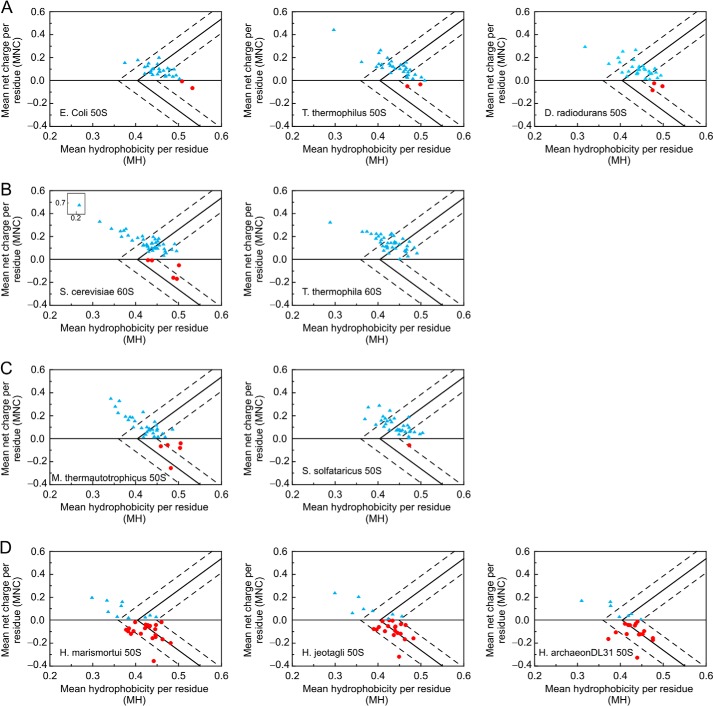
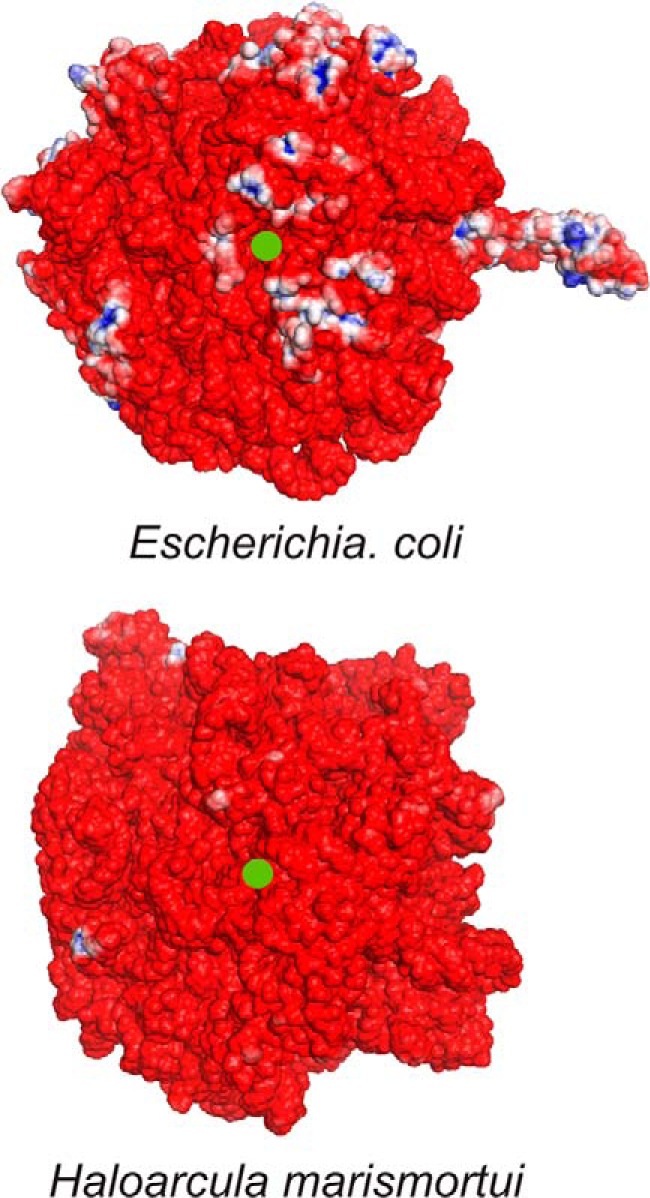
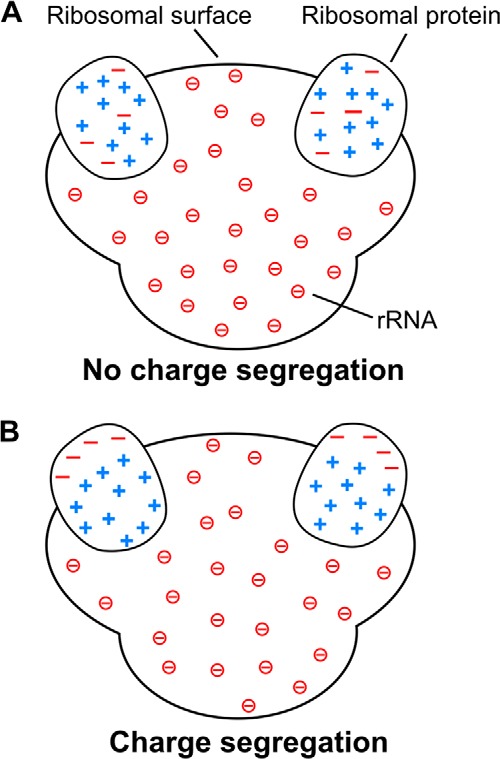
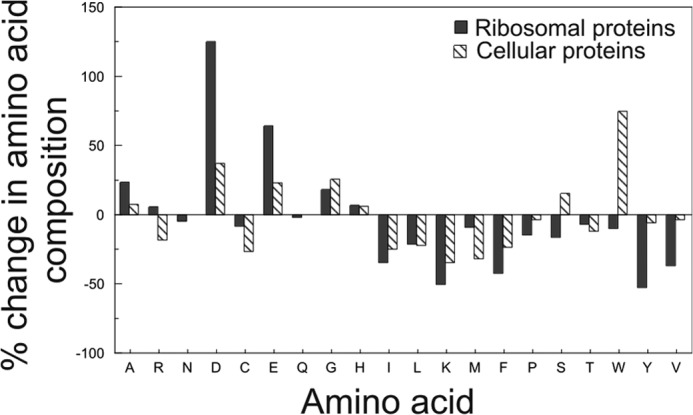
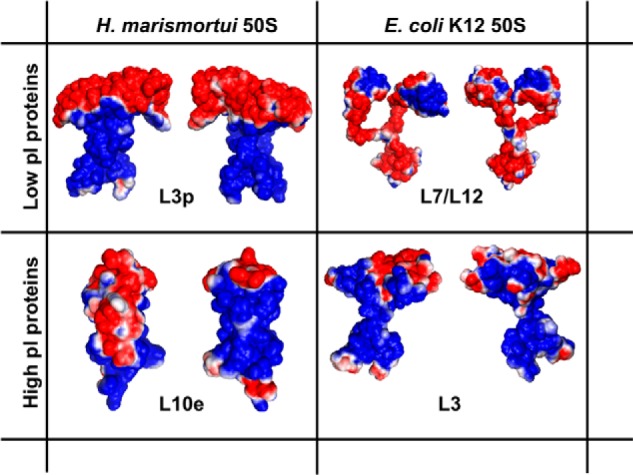
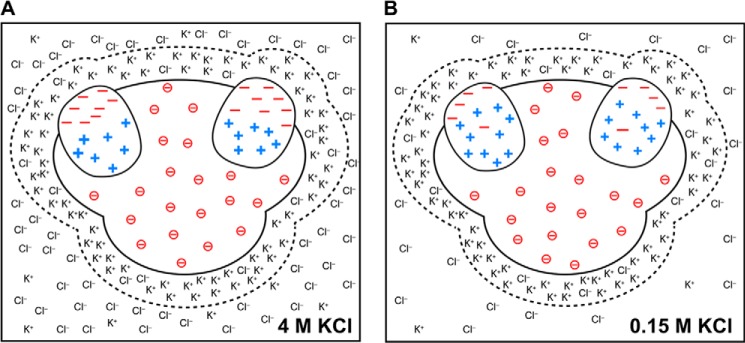
Ribosomes are large and highly charged macromolecular complexes consisting of RNA and proteins. Here, we address the electrostatic and nonpolar properties of ribosomal proteins that are important for ribosome assembly and interaction with other cellular components and may influence protein folding on the ribosome. We examined 50 S ribosomal subunits from 10 species and found a clear distinction between the net charge of ribosomal proteins from halophilic and non-halophilic organisms. We found that ∼67% ribosomal proteins from halophiles are negatively charged, whereas only up to ∼15% of ribosomal proteins from non-halophiles share this property. Conversely, hydrophobicity tends to be lower for ribosomal proteins from halophiles than for the corresponding proteins from non-halophiles. Importantly, the surface electrostatic potential of ribosomal proteins from all organisms, especially halophiles, has distinct positive and negative regions across all the examined species. Positively and negatively charged residues of ribosomal proteins tend to be clustered in buried and solvent-exposed regions, respectively. Hence, the majority of ribosomal proteins is characterized by a significant degree of intramolecular charge segregation, regardless of the organism of origin. This key property enables the ribosome to accommodate proteins within its complex scaffold regardless of their overall net charge.

Keywords: Archaea; Bacteria; Electrostatics; Hydrophobicity; Net Charge; Protein Folding; Protein Stability; Ribosomal Proteins; Ribosomes.


Figures

FIGURE 1.
FIGURE 1.
Hydrophobicity and pI of ribosomal proteins in the large subunit of the ribosome from nine organisms. Red solid squares, 50 S ribosomal proteins from halophilic archaea H. marismortui, H. jeotgali, and halophilic archaeon DL31; blue solid circles, eukaryotic 60 S ribosomal proteins from S. cerevisiae and T. thermophila; black open circles, bacterial 50 S ribosomal proteins from E. coli, T. thermophilus, and D. radiodurans; orange crosses, 50 S ribosomal proteins from non-halophilic archaea S. solfataricus and M. thermautotrophicus. The vertical dotted line denotes the physiological pH of 7.4.
FIGURE 2.
FIGURE 2.
Plots illustrating the MNC versus MH of proteins from the large ribosomal subunits of different organisms. Data are shown for bacteria (A), Eukaryota (B), non-halophilic archaea (C), and halophilic archaea (D). Light blue triangles and red circles denote proteins with positive and negative MNC, respectively. The solid line separates IDPs (on the left) from independently folded proteins (on the right). The regions on the left, right, and in between the dashed lines host IDPs, folded, and partially ordered proteins, respectively. Calculations were performed based on the UniProt Knowledgebase sequence information (see “Experimental Procedures”). H. archaeon, halophilic archaeon.
FIGURE 3.
FIGURE 3.
Electrostatic surface potential maps of the 50 S subunit of ribosomes from E. coli and H. marismortui in proximity to the exit tunnel. The ribosomal exit tunnel is denoted by a green dot. Electrostatic potentials were obtained with APBS (150 mm ionic strength, solute dielectric of 2.0, and solvent dielectric of 78.0) using three-dimensional structures with Protein Data Bank codes 2AW4 (56) and 2QA4 (57) for E. coli and H. marismortui, respectively. Regions with positive (>+3 kBT/e) and negative potential (<−3 kBT/e) are shown in blue and red, respectively. kBT denotes an energy unit of 4.11 × 10⁻²¹ J at room temperature (where kB is the Boltzmann constant and T is temperature), and e denotes the electric charge in coulombs.
FIGURE 4.
FIGURE 4.
Schematic models for the charge distribution of ribosomal proteins illustrating the charge segregation concept. A, ribosomal proteins with no intramolecular charge segregation. B, ribosomal proteins with intramolecular charge segregation supported by this study. The negative charges enclosed in circles are from the phosphate groups of rRNA. For simplicity, only two ribosomal proteins are shown embedded in each ribosome.
FIGURE 5.
FIGURE 5.
Percent change in amino acid composition of ribosomal and cellular proteins from non-halophilic to halophilic organisms. The black bars denote ribosomal proteins. The striped bars denote selected cellular proteins according to Rao and Argos (25). No data are available for the asparagine (N) and glutamine (Q) content of cellular proteins. Data were generated from the amino acid sequences of ribosomal proteins from seven non-halophilic and three halophilic organisms (details are given under “Experimental Procedures”).
FIGURE 6.
FIGURE 6.
Electrostatic surface potential map of four representative 50 S ribosomal proteins. Front and back views are shown for L3p and L10e from H. marismortui and L7/L12 and L3 from E. coli. Protein Data Bank code information is as follows: L3p, chain B of 2QA4 (57); L7/L12, 1RQU (58); L10e, chain H of 2QA4; L3, chain D of 2AW4 (56).
FIGURE 7.
FIGURE 7.
Schematic model illustrating the proposed charge distribution in ribosomes from halophilic and non-halophilic organisms. A, ribosome from a halophile in 4 m KCl. B, ribosome from a non-halophile in 150 mm KCl. The dashed lines around the ribosomal surfaces enclose a simplified view of counterion layers and emphasize the postulated similarity of these layers in halophilic and non-halophilic organisms. For simplicity, only two ribosomal proteins are shown embedded in each ribosome.

References

    1. Harms J., Schluenzen F., Zarivach R., Bashan A., Gat S., Agmon I., Bartels H., Franceschi F., Yonath A. (2001) High resolution structure of the large ribosomal subunit from a mesophilic eubacterium. Cell 107, 679–688 - PubMed
    1. Selmer M., Dunham C. M., Murphy F. V., 4th, Weixlbaumer A., Petry S., Kelley A. C., Weir J. R., Ramakrishnan V. (2006) Structure of the 70S ribosome complexed with mRNA and tRNA. Science 313, 1935–1942 - PubMed
    1. Yusupov M. M., Yusupova G. Z., Baucom A., Lieberman K., Earnest T. N., Cate J. H., Noller H. F. (2001) Crystal structure of the ribosome at 5.5 Å resolution. Science 292, 883–896 - PubMed
    1. Ramakrishnan V. (2011) Molecular biology. The eukaryotic ribosome. Science 331, 681–682 - PubMed
    1. Melnikov S., Ben-Shem A., Garreau de Loubresse N., Jenner L., Yusupova G., Yusupov M. (2012) One core, two shells: bacterial and eukaryotic ribosomes. Nat. Struct. Mol. Biol. 19, 560–567 - PubMed

Publication types

MeSH terms

Substances

LinkOut - more resources