. 2014 Jan;120(1):172-84.
doi: 10.1097/ALN.0000000000000071.

Automated near-real-time clinical performance feedback for anesthesiology residents: one piece of the milestones puzzle

Affiliations

Automated near-real-time clinical performance feedback for anesthesiology residents: one piece of the milestones puzzle

Jesse M Ehrenfeld et al. Anesthesiology. 2014 Jan.

Abstract

Background: Anesthesiology residencies are developing trainee assessment tools to evaluate 25 milestones that map to the six core competencies. The effort will be facilitated by development of automated methods to capture, assess, and report trainee performance to program directors, the Accreditation Council for Graduate Medical Education and the trainees themselves.

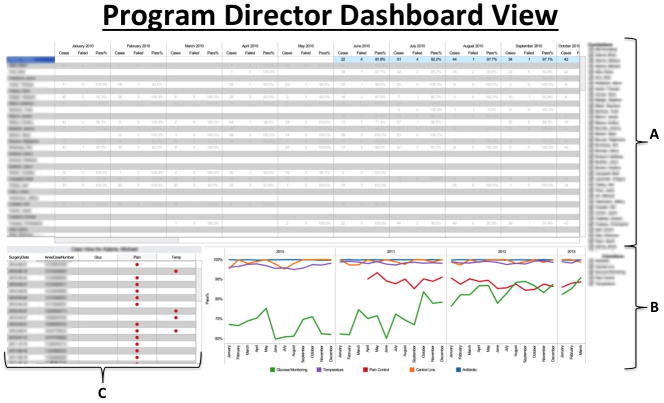
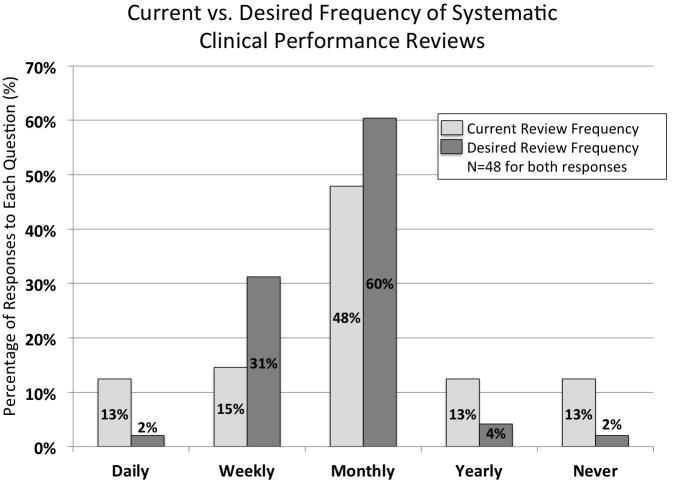
Methods: The authors leveraged a perioperative information management system to develop an automated, near-real-time performance capture and feedback tool that provides objective data on clinical performance and requires minimal administrative effort. Before development, the authors surveyed trainees about satisfaction with clinical performance feedback and about preferences for future feedback.

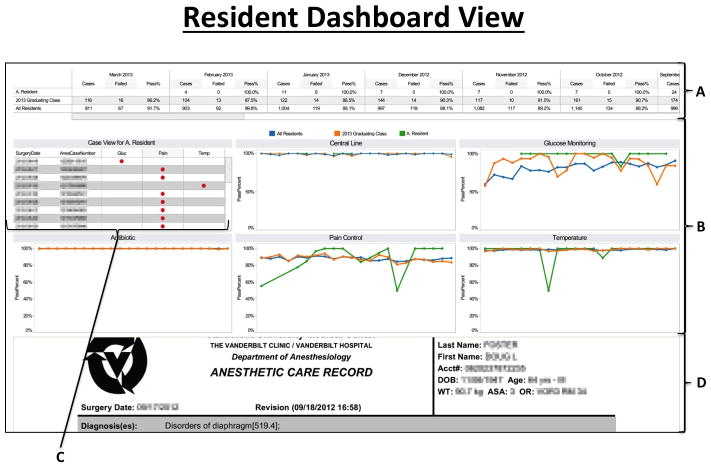
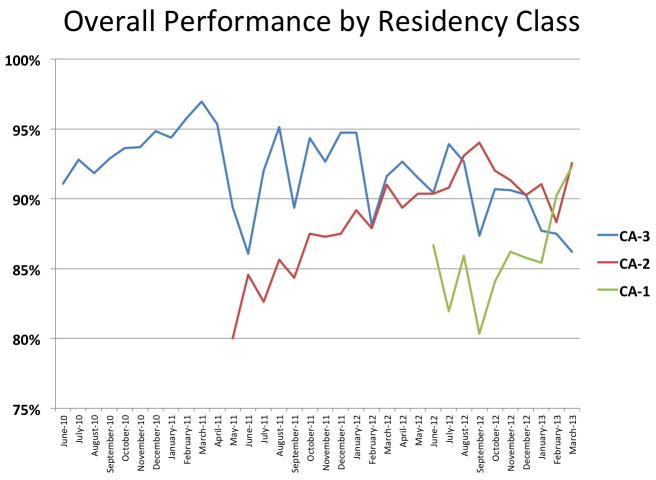
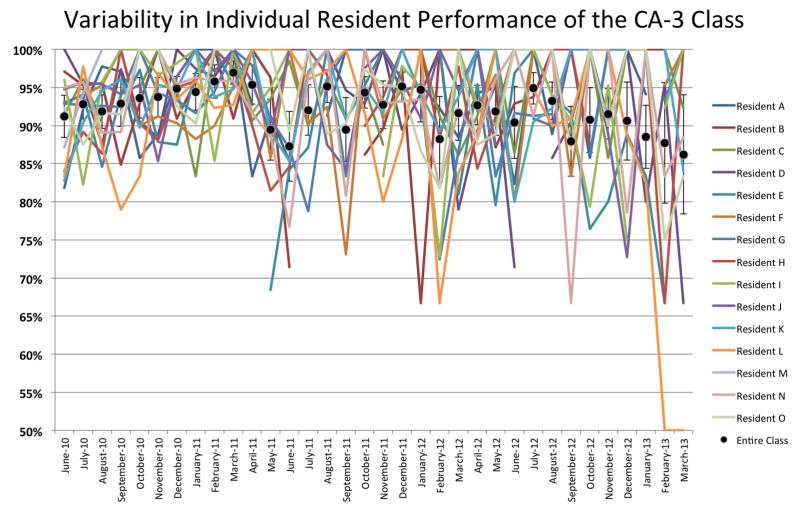
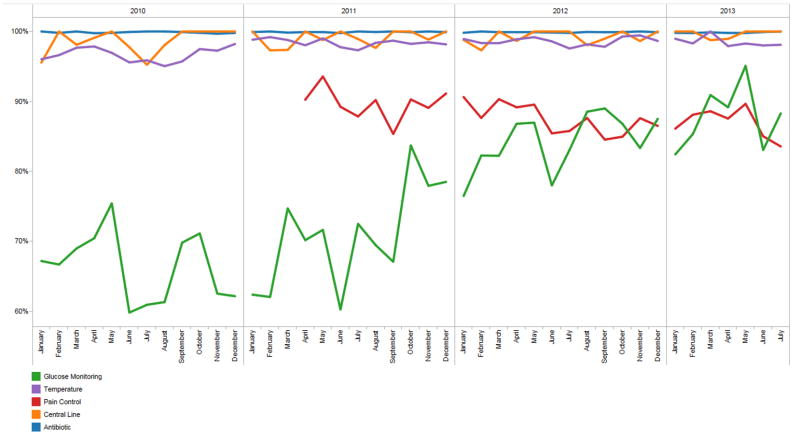
Results: Resident performance on 24,154 completed cases has been incorporated into the authors' automated dashboard, and trainees now have access to their own performance data. Eighty percent (48 of 60) of the residents responded to the feedback survey. Overall, residents "agreed/strongly agreed" that they desire frequent updates on their clinical performance on defined quality metrics and that they desired to see how they compared with the residency as a whole. Before deployment of the new tool, they "disagreed" that they were receiving feedback in a timely manner. Survey results were used to guide the format of the feedback tool that has been implemented.

Conclusion: The authors demonstrate the implementation of a system that provides near-real-time feedback concerning resident performance on an extensible series of quality metrics, and which is responsive to requests arising from resident feedback about desired reporting mechanisms.


Conflict of interest statement

Conflict of Interest: The authors declare no competing interests

Figures

Figure 1
Figure 1
This figure displays the Program Director dashboard view which is accessed through a password-protected website. The different panels comprising this dashboard show: A) tabular numerical listings of individual resident scores plotted by case pass/failure rate by month, with ‘pass/fail’ as a binary score taking into account passing on all 5 metrics or not; B) color-coded graphical representation of performance of all residents on each individual metric over time; and C) listings of individual cases in which occurred, with each row representing one case and the metric(s) failed in that case being depicted by the red dots. In this portion of the dashboard, a read-only version of the anesthesia record for a case in question can be accessed from our AIMS by clicking on the case (one row represents one case). Additionally, in panel ‘A’ in the figure, resident performance can be sorted by column in ascending or descending order, giving the program director immediate access to the residents that are top performers and those that are low performers on defined quality metrics. Thus, the Program Director can quickly assess individual resident performance and global programmatic performance from this one dashboard. [AIMS = Anesthesia Information Management System]
Figure 2
Figure 2
This figure displays the Resident dashboard view which is accessed through a password-protected website. The different panels comprising this dashboard show: A) a tabular view of the performance of a single resident in comparison to CA training level and entire program by month, with ‘pass/fail’ as a binary score taking into account passing on all 5 metrics or not; case pass/fail rate; B) a graphical representation of the performance of single resident in comparison to CA level and entire program by individual metrics by month; C) individual case listings showing where resident performance failures occurred; and D) the PDF form of the case record in our AIMS can be accessed by clicking on one of the cases listed in panel C. [CA = Clinical Anesthesia; AIMS = Anesthesia Information Management System]
Figure 3
Figure 3
This figure depicts the resident responses to questions on an anonymous survey administered during the development phase of the feedback tool. The questions asked about the resident’s current and desired frequency of systematic clinical performance reviews. Results are demonstrated as the percentage of respondents answering in the categories offered. Of note, over 25% of residents said that they currently perform any systematic review of their performance at a frequency of once per year or less, whereas 91% stated that they would like a systematic review every 1–4 weeks. N=48 for both questions.
Figure 4
Figure 4
This figure illustrates the overall case pass rate of each of our current residency classes by month over the past 36-months. Of note, there is no demonstrable improvement over time, as would be expected with longer periods of training, and as is expected to be demonstrated in the Milestones Project.
Figure 5
Figure 5
This figure represents marked variability in the percentage case pass rate of individual residents of the current CA-3 class by month over their entire anesthesia residency, which starts with a month of anesthesia in June at the end of intern year. [CA = clinical anesthesia] There is no discernible pattern of improvement in performance for any resident over time when practicing in a system where feedback on quality metrics was not provided.
Figure 6
Figure 6
This figure represents the overall programmatic performance on each of the five quality metrics over the study period and that most of the case failures are accounted for by the glucose monitoring and pain metrics. There is an observed improvement in glucose monitoring and temperature management over time, and the variability in central line documentation shows a reduction. Much of the improvement in glucose monitoring is likely due to decision support reminders embedded in our anesthesia information management system. Pain management does not appear to improve; however, our data shows that on average >90% of patients arrive to the PACU with a pain score <7. [PACU = post-anesthesia care unit]

References

    1. Nasca TJ, Philibert I, Brigham T, Flynn TC. The next GME accreditation system--rationale and benefits. N Engl J Med. 2012;366:1051–6. - PubMed
    1. Brown DL. Using an anesthesia information management system to improve case log data entry and resident workflow. Anesth Analg. 2011;112:260–1. - PubMed
    1. Simpao A, Heitz JW, McNulty SE, Chekemian B, Brenn BR, Epstein RH. The design and implementation of an automated system for logging clinical experiences using an anesthesia information management system. Anesth Analg. 2011;112:422–9. - PubMed
    1. O’Reilly M, Talsma A, VanRiper S, Kheterpal S, Burney R. An anesthesia information system designed to provide physician-specific feedback improves timely administration of prophylactic antibiotics. Anesth Analg. 2006;103:908–12. - PubMed
    1. Spring SF, Sandberg WS, Anupama S, Walsh JL, Driscoll WD, Raines DE. Automated documentation error detection and notification improves anesthesia billing performance. Anesthesiology. 2007;106:157–63. - PubMed

Publication types