Spatio-temporal analysis on enterovirus cases through integrated surveillance in Taiwan
- PMID: 24400725
- PMCID: PMC3890494
- DOI: 10.1186/1471-2458-14-11
Spatio-temporal analysis on enterovirus cases through integrated surveillance in Taiwan
Abstract
Background: Severe epidemics of enterovirus have occurred frequently in Malaysia, Singapore, Taiwan, Cambodia, and China, involving cases of pulmonary edema, hemorrhage and encephalitis, and an effective vaccine has not been available. The specific aim of this study was to understand the epidemiological characteristics of mild and severe enterovirus cases through integrated surveillance data.
Methods: All enterovirus cases in Taiwan over almost ten years from three main databases, including national notifiable diseases surveillance, sentinel physician surveillance and laboratory surveillance programs from July 1, 1999 to December 31, 2008 were analyzed. The Pearson's correlation coefficient was applied for measuring the consistency of the trends in the cases between different surveillance systems. Cross correlation analysis in a time series model was applied for examining the capability to predict severe enterovirus infections. Poisson temporal, spatial and space-time scan statistics were used for identifying the most likely clusters of severe enterovirus outbreaks. The directional distribution method with two standard deviations of ellipse was applied to measure the size and the movement of the epidemic.
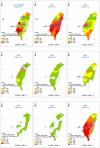
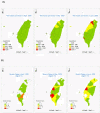
Results: The secular trend showed that the number of severe EV cases peaked in 2008, and the number of mild EV cases was significantly correlated with that of severe ones occurring in the same week [r = 0.553, p < 0.01]. These severe EV cases showed significantly higher association with the weekly positive isolation rates of EV-71 than the mild cases [severe: 0.498, p < 0.01 vs. mild: 0.278, p < 0.01]. In a time series model, the increase of mild EV cases was the significant predictor for the occurrence of severe EV cases. The directional distribution showed that both the mild and severe EV cases spread extensively during the peak. Before the detected spatio-temporal clusters in June 2008, the mild cases had begun to rise since May 2008, and the outbreak spread from south to north.
Conclusions: Local public health professionals can monitor the temporal and spatial trends plus spatio-temporal clusters and isolation rate of EV-71 in mild and severe EV cases in a community when virus transmission is high, to provide early warning signals and to prevent subsequent severe epidemics.
Figures


References
-
- Severe complications of hand, foot and mouth disease (HFMD) caused by EV-71 in Cambodia – conclusion of the joint investigation. http://www.who.int/csr/don/2012_07_13/en/index.html.
Publication types
MeSH terms
LinkOut - more resources
Full Text Sources
Other Literature Sources

