

Review
doi: 10.1021/cr400415k.
Epub 2014 Jan 8.
Heme enzyme structure and function
Affiliations
- PMID: 24400737
- PMCID: PMC3981943
- DOI: 10.1021/cr400415k
Item in Clipboard
Review
Heme enzyme structure and function
Chem Rev.
.
No abstract available
Figures

Structure of iron protoporphyrin IX.

Oxygen and peroxide activation by heme enzymes. Oxygenases like P450 must have the iron reduced to ferrous (Fe(II) or Fe2+) before O2 can bind. The oxy complex is best described as ferric-superoxide, Fe(III)-OO−. A second electron transfer results in reduction of superoxide to the peroxide level. At this point the P450 and peroxidase mechanisms are similar. The distal O atom must be protonated to ensure heterolytic cleavage of the O-O bond resulting in the departure of water which leaves behind an O atom with only 6 valence electrons. A rearrangement of oxidizing equivalents results in the active oxidant often called Compound I.

Spectra of the various intermediates in HRP catalysis. This figure was adapted from Dunford.

Crystal structure of yeast cytochrome c peroxidase (CCP). The F helix contains the proximal His175 heme ligand which is H-bonded to the conserved Asp235. The B helix provides the His52 acid-base catalyst and Arg48 which helps to stabilize the ferryl center in Compound I. Trp191 forms a cation radical in Compound I.

Mechanism of peroxidase Compound I formation. In the original mechanism the distal His shuttles the peroxide O1 proton to the O2 oxygen which promotes heterolysis of the O-O bond. However, the distal His is too far from O1 for direct H-bonding so in the modified mechanism, a water molecule assists in the transfer of the O1 proton to O2.

Crystal structure of CCP Compound I which is basically the same as the HRP Compound I structure. The water molecule H-bonded to the ferryl O atom is ideally positioned to assist His52 in acid-base catalysis as suggested.

A) Plot of computed stretching frequency vs. Fe-O bond distance (dark and clear circles, adapted from Green). Clear diamonds are from resonance Raman or EXAFS, and the dark diamonds from x-ray crystal structures. A majority of the experimental determinations from EXAFS and resonance Raman fit well to the theoretical plot. The main outliers that overestimate the distance are derived from crystals structures. B) Plot of x-ray dose vs. the Fe-O bond distance in CCP Compound I adapted from Meharenna et al.. This plot was based on the refinement of 13 crystal structures with increasing x-ray dose. The plot extrapolates back to a Fe-O bond distance of 1.72Å to be compared with 1.68Å obtained from resonance Raman data.

Location of the monovalent cation in APX and LmP (water in CCP) that is about 8Å from the proximal pocket Trp. The EPR spectra are of the Trp radical in all three peroxidases for both wild type and mutant forms. In CCP the mutant spectrum was generated from a CCP where the APX K+ site was introduced., For the APX mutant the three Met residues important for stabilizing the Trp radical in CCP were introduced. For wild type APX the radical is about 0.09 spin equivalents while for the mutant this increases to 0.24. These experiments illustrate that it is possible to turn on/off the Trp radical signal by modifying the local electrostatic environment.

Outline of the stopped flow method used to measure the life time of the Trp radical in various mutants of CCP. This approach centers on the fact that rapid electron transfer from Cyt c to CCP Compound I requires the Trp radical. In a double mix experiment, CCP Compound I is formed in the first mix, allowed to age for various delay times, and then in the second mix reduced Cyt c is added. As the Trp radical decays the rate and extent of Cyt c oxidation will decrease as the delay time is increased. Mutating Tyr236 to Phe increases the lifetime of the Trp191 radical even in the CCP mutants designed to have a destabilized Trp191 radical. The most likely reason is that the Trp191 radical has been kinetically trapped since the nearest Tyr residue capable of forming a relatively stable radical, Tyr236, has been changed to Phe.

An early unpublished Fo-Fc electron density map from our lab showing a large lobe of difference density about 1.5Å from the Cβ carbon of Trp171. The proposed mechanism involves oxidation of Trp171 by Compound I.

Structure and mechanism of diheme bacterial cytochrome c peroxidases. In the inactive state both the LP (low potential) and HP (high potential) hemes are Fe3+ and low spin. Upon reduction of the HP heme, the His171 LP heme ligand is displaced and swings out to the surface which frees up one axial coordination position for peroxide binding. In addition Glu114 moves from the surface into the active site where it likely serves an acid-base catalytic role in Compound I formation. The overall mechanism is very similar to other peroxidases except a porphyrin or amino acid radical is not involved. Instead the second electron required for peroxide activation derives from the HP heme.

Substrate binding sites in manganese (MnP) and ascorbate (APX) peroxidases. Both use one heme propionate for binding which provides a direct electron transfer path along the heme propionate to the porphryin radical and Fe(IV) center.

Crystal structures of the CCP-Cyt c and LmP-Cyt c complexes. The peroxidases are oriented the same which shows that the cyt c, while binding to the same surface, is oriented quite differently. In the LmP-Cyt c complex one strong (Arg24-Asp211) and one weaker salt bridges (Lys98-Glu49) form while there are no ion pairs in the yeast CCP-Cyt c complex. Although the cyt cs differ in orientation, the heme edge of cyt c contacts the same section of polypeptide in both complexes so the ET distance is the same. However, the types of amino acids and local electrostatic environment along the ET path are substantially different.

A scheme showing the interaction between redox partners. The large complementary electrostatic surfaces (light gray) result in rapid formation of the initial inter-protein complex. The active interaction regions (dark gray) are much smaller so redox partners must sample each other’s surfaces before the ET active orientation is reached which is governed by k2. The actual ET event is fast so the rate limiting step under steady state conditions can be a complicated mix of the various rate constants which are heavily influenced by ionic strength.

Crystal structure and mechanism of prostaglandin H synthase. A) Overall view. B) Active site structure showing how arachidonic acid (cyan color labeled AA) binds. Tyr385 forms a radical upon oxidation with peroxide. The resulting Tyr385 abstracts an H atom from AA leading to subsequent reactions with oxygen to give the final products. C) Overall mechanism for the conversion of arachidonic acid to PGH2. The Tyr385 radical abstracts an H atom from arachidonic acid and the resulting radical intermediate reacts with 2 O2 molecules to give PGG2. PGG2 can be converted to PGH2 by serving as the peroxide substrate in forming Compound I or PGG2 is reduced by endogenous reductants to give PGH2. D) Overall PGHS reaction cycle. In the presence of a suitable reducing substrate the peroxidase part of the reaction functions independent of the cyclooxygenase reaction. However, the cyclooxygenase activity requires the Tyr385 radical which forms by reaction with Compound I generated by the peroxidase reaction.

Crystal structure of P450cam.
A) Overall structure viewed looking along the heme normal with the substrate binding site facing the viewer. The I helix runs directly over the heme and provides part of the O2 binding pocket. B) Detailed structure around the Cys357 heme ligand. This structure is highly conserved in all P450s and forms a tight β-bulge structure. Note the H-bond between the Cys357 S atom and a peptide NH group which helps to modulate the heme iron redox potential. C) Close up of the I helix near the O2 binding site. The local helical H-bonding pattern is disrupted and Gly248 no longer participates in an α–helical H-bond but instead accepts an H-bond from the highly conserved Thr252.

Some examples of open and closed structures in bacterial P450cin, and mammalian P4502B4., The F and G helices which experience the largest movement are in cyan.

Crystal structures solved in our lab of various P450-substrate complexes. They vary widely in size, shape, and polarity. In some cases, as in P450eryF, water participates directly in substrate binding by forming an H-bonding bridge between the substrate and protein. In all these and other examples, the atom to be hydroxylated is within 4–5Å to the iron and thus can directly interact with the Fe(IV)=O O atom.

P450 starts off as low-spin hexacoordinate and when substrate (SH) binds, the axial water ligand is displaced and the heme shifts to high spin and the redox potential increases. This enables electron transfer from the redox partner to proceed to give the oxy complex. This is followed by a second electron transfer step that ultimately generates the dihydroperoxy species which undergoes heterolytic cleavage to give Compound I.

A) Overall structure of P450BM3 complexed with its redox partner.
B) Structure of P450 reductase. The FMN and FAD cofactors are in direct contact and it now is generally thought that the FMN module must dissociate and reorient in order for the FMN domain to properly dock to the P450. C) Close up view of the P450BM3-redox partner interface. Specific groups at the interface were chemically modified to probe the importance of these residues and these studies proved to be consistent with the crystal structure. Glu387Cys and Cys62 were labeled with a Ru reagent to enable photo-induced electron transfer (panel D) to be measured. ET from Cys387 proceeds rapidly but not from Cys62 despite the Cys-iron distance being about the same. This result indicates that ET along the polypeptide from the modified Gln387Cys to Cys400 is the preferred ET path.

Crystal structure of the complex formed between CYP11A and Fe2S2 redox partner, adrenodoxin.

A) Hypothetical model of the P450cam-Pdx complex. Highlighted are the B′ and C helices that NMR studies show are the most perturbed by Pdx binding.
B) NMR spectra showing the effects of Pdx binding and the Leu358Pro mutant. a,d,x, and y have been assigned to the β-proton of the Cys357 ligand, the γ-methyl proton of Thr252, the 9-methyl group, and 5-exo proton of camphor, respectively. This figure was reproduced from reference . C) The effect of Pdx on the Infrared CO stretching frequency in CO-P450cam. This figure was reproduced from reference .
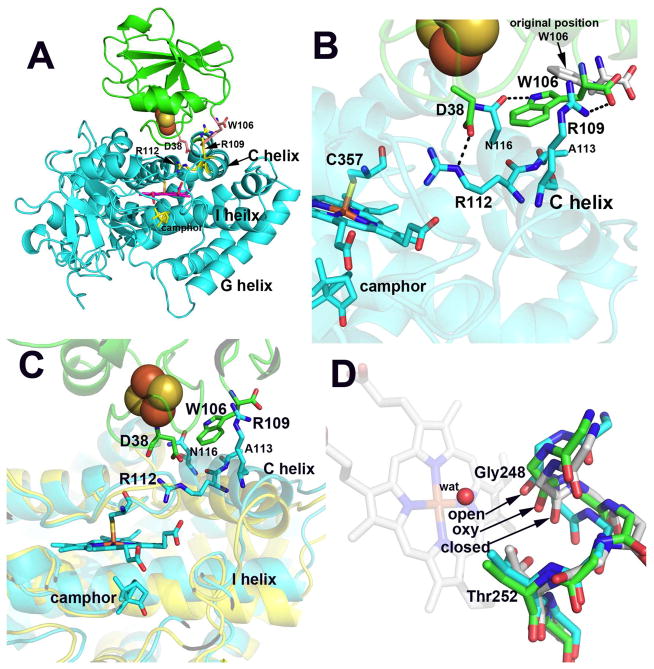
A) Overall structure of the P450cam-Pdx complex. B) Close up of the interface. The only significant change in Pdx is that PdxTrp106 adopts a new rotamer conformation in order to interact with P450cam. The ion pair formed between P450camArg112 and PdxAsp38 requires little movement but the interactions between PdxTrp106 and P450cam require about a 2–3Å movement of the C helix up toward Pdx. C) The closed (yellow) P450cam structure superimposed on the open (cyan) structure. The C helix motion is coupled to changes in the I helix. D) The superposition of the I helix in the closed, oxy, and open P450cam structures. In the closed structure Thr252 forms a tight H-bond with the carbonyl O atom of Gly248. In the open conformation this H-bond is weakened which enables Gly248 to move closer to the axial heme water ligand for H-bonding interactions. The motion of the I helix when O2 binds is midway between these two extremes. The widening of the I helix groove in the oxy complex allows key waters to move in to the active site to establish the proton relay network required for O2 activation.

Comparison of the I helix environment in the Fe(III), oxy, and T252A mutant of P450cam. When O2 binds the H bond between Thr252 and Glu248 is broken and the I helix opens up. This provides additional room for water molecules to establish an H-bonding network that is generally considered to be important for promoting O-O bond heterolysis. The T242A mutant adopts the same open conformation.

The probable H-bonding arrangement in the oxy-P450cam complex. The distal O2 oxygen atom is close to a peptide carbonyl and the Thr252 side chain oxygen atoms which is electrostatically unfavorable and will promote protonation of the distal O atom.

A Initial mechanism for the role of Asp251 in O2 activation.. The arrows indicate the direction of proton flow. The main modification to the original proposal is the removal of Thr252 as a proton donor to O2. The weight of the evidence favors Thr252 serving as an H bond acceptor. The most recent proposal based on the P450cam-Pdx structure removes Arg186 and Lys178 from the mechanism since the ion pairs with Asp251 are broken which frees Asp251 to pick up protons from bulk solvent and then rotate into the active site to deliver protons to dioxygen. B) The oxy-P450cam structure was superimposed on to the P450cam-Pdx structure so the dioxygen and water molecule shown are from the oxy-P450cam structure and the rest is from the P405cam-Pdx structure. One of the favored rotamers of Asp251 places Asp251 in an ideal position to interact with the active site water found in the oxy-P450cam structure. C) The Asp251 ion pairs found in the closed ferric substrate bound P450cam structure. D) The environment of Asp251 when Pdx binds. The ion pairs are broken and the active site opens up which frees Asp251 to shuttle protons from bulk solvent to the active site.

The structure of P450BSβ The I helix has an Arg that interacts with the fatty acid substrate carboxyl group. This places the carboxyl group in position to serve a similar acid/base catalytic function as the distal His in more traditional peroxidases.

A) Mechanism proposed for prostacylcin synthase. B) The substrate-free (white) and substrate analog-bound (gray) structures of zebra fish PGIS. The arrow shows the direction of heme movement when substrate binds. The movement is required to enable the U51605 N atom to coordinate with the heme iron. In the substrate-free state the iron thus is “protected” from non-specific interactions with other potential ligands.

The substrate-free and -bound forms of zebra fish PGIS. For clarity the substrate analog in the bound state is not shown. As the heme slides from the free to bound state, H-bonds are lost between the axial water ligand and surrounding protein groups but new ones are made between the heme propionate and Arg339 and Gln94.

Possible mechanisms for Cyp74A and Cyp74B.,–,. The proposed mechanisms are not limited to those shown but are consistent with the crystal structures and especially the mutagenesis work where the replacement of Phe137 converts AOS (Cys74A) into CYP74B. Given the close proximity of C11 to Phe137, the Phe ring stabilizes the radical and carbocation on C11 thus favoring formation of allene oxide. In Cyp74B, however, Phe137 is replaced with Leu. Therefore, radical formation on C13 is favored and given the close proximity of C13 to the ferryl O atom, radical rebound gives the final hemiacetal product.

Structure of rat nNOS. A) Ribbon diagram of the nNOS dimer. A single Zn2+ ion is tetrahedrally coordinated to pairs of symmetry related Cys residues exactly along the dimer axis. B) Surface diagram showing the exposure of the heme active site pocket. C) Close-up view of the active site showing the interactions between the substrate, L-Arg, and surrounding protein groups. The cofactor, BH4, is bound in a pocket at the dimer interface where it H-bonds with the same heme propionate as the substrate. D) The Cys ligand environment showing the H-bond between the Cys and Trp409.

Two possible mechanisms for the oxidation of Nω-L-hydroxyarginine (L-NHA) by NOS. In the BH4 radical mechanism BH4 reduces the oxy complex to the peroxy species which then forms the cyclic intermediate. This collapses to give L-citrulline and NO−. The BH4 radical then is reduced by NO− to give nitric oxide. In the no BH4 radical mechanism the source of the electron is the substrate itself rather than BH4 which gives the ferric-peroxy species. The cyclic intermediate then collapses to give the final products.

Cartoon representation of the how NOS is regulated by calmodulin (CaM). All mammalian NOS isoforms dimerize through the heme domain. The binding of CaM to the linker results in a structural change that enable the FMN of molecule A in the dimer to transfer electrons to the heme of molecule B.

A) The nNOS reductase structure. The reductase domain of NOS is very similar to P450 reductase. In both structures the FMN and FAD are in close proximity and form direct non-bonded contacts. B) Crystal structure of the iNOS FMN domain complexed with calmodulin. The grey spheres in CaM represent Ca2+ ions.

Fluorescence emission spectra of nNOS ±CaM adapted from.

A) Various redox states available to FMN. B) Fluorescence emission spectra of the ΔGy810 nNOS mutant showing that CaM has little effect. C) Comparison of the FMN loop region in nNOS (green) and P450BM3 (white). D) Close-up view at the FMN-FAD interface showing the Asn811-Glu1392 H-bond which is most likely lost int he ΔGly810 mutant. This could loosen the FMN-FAD interaction thus accounting for the lack of any significant change in fluorescence when CaM is bound. These figures were adapted from.

Procedure developed by Feng et al. to measure electron transfer from the NOS FMNH2 hydroquinone to Fe(III). Deazariboflavin (dRF) is photo-reduced using a sacrificial electron donor (D) like semicarbazide. This reduces both FMN and iron which, in the presence of CO, forms Fe(II)-CO. Flashing off the CO generates Fe(II) which reduces the flavin semquinone to the hydroquinone, FMNH2, which enables the FMNH2-to-Fe(III) ET rate to be measured. This procedure isolates the key CaM-dependent ET reaction.

Two views of the nNOS dimer showing the patch of positive electrostatic potential that could serve as the FMN docking site. A conserved Trp residue is positioned on the backside of the heme near the surface and could possibly serve as a conduit for electron transfer from FMN.

A) Reactions catalyzed by CPO. B) Crystal structure of CPO in a complex with itsxsubstrate cyclopentanedione (yellow).
C) A surface diagram of CPO showing the small opening just above the heme that provides the most likely route of substrates into the active site. D) Close-up view of the CPO active site.
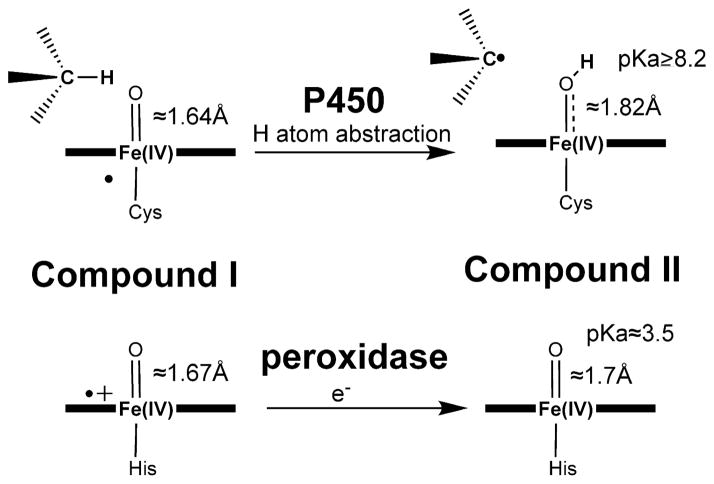
The difference between the oxyferryl center in P450 and peroxidase. The distances shown are taken from the EXAFS data of Green et al. The radical in P450 Compound I is depicted as being shared by the sulfur and porphyrin as depicted by Green et al. although QM/MM calculations indicate the local protein electrostatic environment favors a porphyrin radical. The ferryl center is similar for both in Compound I while in P450 the radical is most likely delocalized between the porphyrin and sulfur ligand while in peroxidase the porphyrin πcation radical dominates. After H atom abstraction in P450 to give Compound II the Fe-O bond increases giving a high pKa ferryl O atom that favors H atom abstraction from the substrate. In peroxidase Compound II the Fe-O bond remains short with a low pKa and as a result peroxidases are poor at H atom abstraction.

QM/MM calculations indicate that Compound I is a mix of near isoenergetic radical states with the radical localized on either the porphyrin or sulfur with the porphyrin radical being the reactive species. Hydroxylation results in a shortening of the S-Fe bond.

Mechanism of heme degradation to billiverdin.

Comparison of the human HO-1 and the HO from P. aerugionosa. The structures share the same helical fold but in the bacterial enzyme the heme is rotated relative to the human enzyme. This places the δ-meso heme carbon at the same position as the α-meso heme carbon in HO-1. The orientation is controlled in part by the cluster of basic side chains that interact with the heme propionates.

A) Overall reaction catalyzed by TDO. B) Original mechanism proposed for TDO where a protein base abstracts the substrate indole proton. C) Sequential addition of O atoms into the substrate via a ferryl intermediate.

IDO and TDO crystal structures. A) The structure of human IDO has an extra domain not found in the bacterial enzyme. B) IDO active site. C) Bacterial TDO structure. D) Active site of bacterial TDO in a complex with the substrate, L-tryptophan.

A) Crystal structure of the MauG-MADH complex. B) The overall reaction of MauG catalyzed formation of TTQ. This is a 6 electron oxidation reaction and thus requires 3 cycles of O2 activation and electron transfer. D) A close up view of the MauG-MADH interface and key Trp residues. Trp93 provides the electronic couple between the two heme such as both hemes behave as a single redox unit. Trp199 is thought to play a key role in electron transfer from the Trp residues destined to become TQQ and the low potential MauG heme.


References
Publication types
MeSH terms
Substances
Grants and funding
LinkOut - more resources
Full Text Sources
Other Literature Sources
Molecular Biology Databases
