

Regulation of red fluorescent light emission in a cryptic marine fish
- PMID: 24401080
- PMCID: PMC3898096
- DOI: 10.1186/1742-9994-11-1
Regulation of red fluorescent light emission in a cryptic marine fish
Abstract
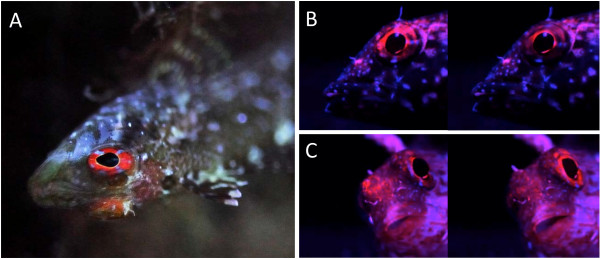
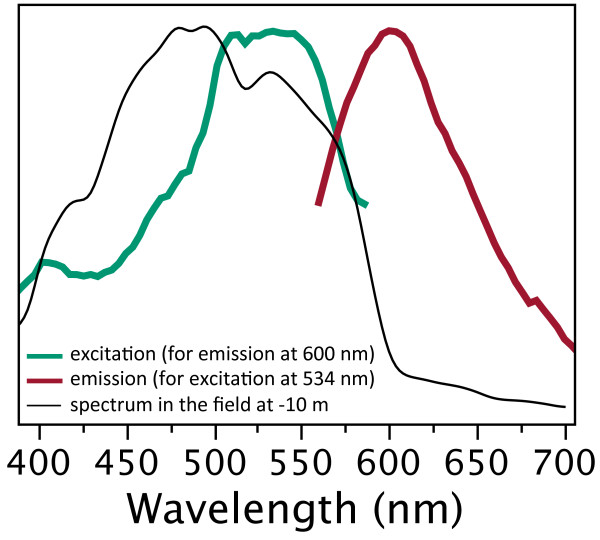
Introduction: Animal colouration is a trade-off between being seen by intended, intra- or inter-specific receivers while not being seen by the unintended. Many fishes solve this problem by adaptive colouration. Here, we investigate whether this also holds for fluorescent pigments. In those aquatic environments in which the ambient light is dominated by bluish light, red fluorescence can generate high-contrast signals. The marine, cryptic fish Tripterygion delaisi inhabits such environments and has a bright red-fluorescent iris that can be rapidly up- and down-regulated. Here, we described the physiological and cellular mechanism of this phenomenon using a neurostimulation treatment with KCl and histology.
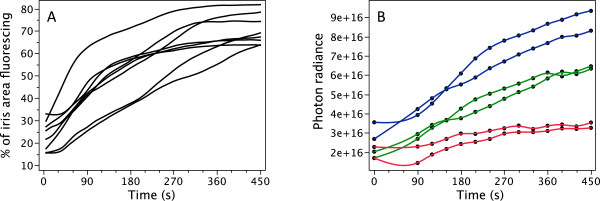
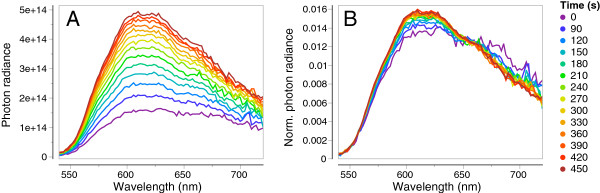
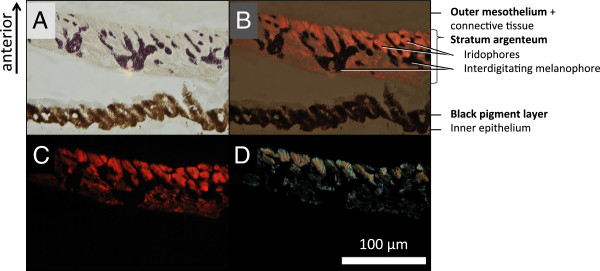
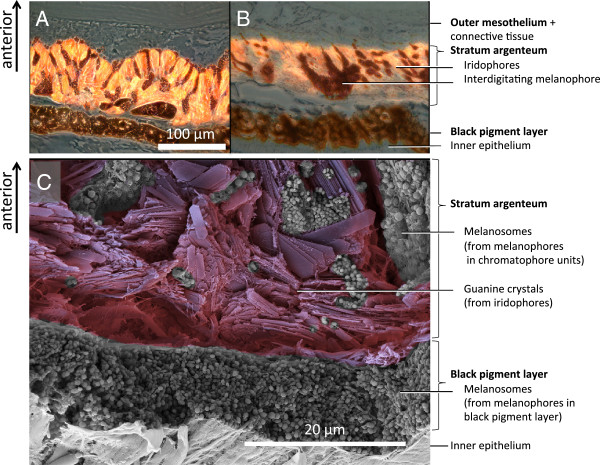
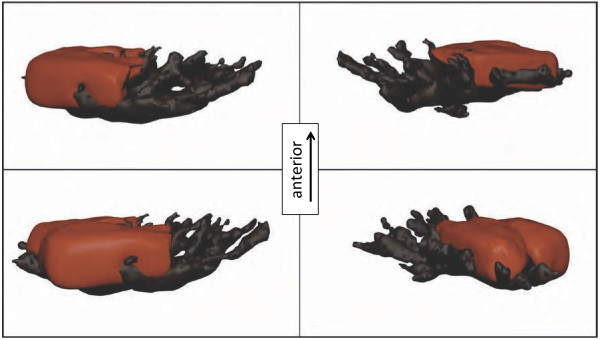
Results: KCl-treatment revealed that eye fluorescence regulation is achieved through dispersal and aggregation of black-pigmented melanosomes within melanophores. Histology showed that globular, fluorescent iridophores on the anterior side of the iris are grouped and each group is encased by finger-like extensions of a single posterior melanophore. Together they form a so-called chromatophore unit. By dispersal and aggregation of melanosomes into and out of the peripheral membranous extensions of the melanophore, the fluorescent iridophores are covered or revealed on the anterior (outside) of the iris.
Conclusion: T. delaisi possesses a well-developed mechanism to control the fluorescent emission from its eyes, which may be advantageous given its cryptic lifestyle. This is the first time chromatophore units are found to control fluorescent emission in marine teleost fishes. We expect other fluorescent fish species to use similar mechanisms in the iris or elsewhere in the body. In contrast to a previously described mechanism based on dendritic fluorescent chromatophores, chromatophore units control fluorescent emission through the cooperation between two chromatophore types: an emitting and an occluding type. The discovery of a second mechanism for fluorescence modulation strengthens our view that fluorescence is a relevant and adaptive component of fish colouration.
Figures
Similar articles
-
The consistent difference in red fluorescence in fishes across a 15 m depth gradient is triggered by ambient brightness, not by ambient spectrum.BMC Res Notes. 2016 Feb 17;9:107. doi: 10.1186/s13104-016-1911-z. BMC Res Notes. 2016. PMID: 26887560 Free PMC article.
-
Red fluorescence in reef fish: a novel signalling mechanism?BMC Ecol. 2008 Sep 16;8:16. doi: 10.1186/1472-6785-8-16. BMC Ecol. 2008. PMID: 18796150 Free PMC article.
-
Do the fluorescent red eyes of the marine fish Tripterygion delaisi stand out? In situ and in vivo measurements at two depths.Ecol Evol. 2018 Apr 15;8(9):4685-4694. doi: 10.1002/ece3.4025. eCollection 2018 May. Ecol Evol. 2018. PMID: 29760908 Free PMC article.
-
Individual colour patches as multicomponent signals.Biol Rev Camb Philos Soc. 2004 Aug;79(3):583-610. doi: 10.1017/s1464793103006390. Biol Rev Camb Philos Soc. 2004. PMID: 15366764 Review.
-
The physiology of flatfish chromatophores.Microsc Res Tech. 2002 Sep 15;58(6):481-7. doi: 10.1002/jemt.10166. Microsc Res Tech. 2002. PMID: 12242705 Review.
Cited by
-
Recent advances in hexavalent chromium removal from aqueous solutions by adsorptive methods.RSC Adv. 2019 Aug 21;9(45):26142-26164. doi: 10.1039/c9ra05188k. eCollection 2019 Aug 19. RSC Adv. 2019. PMID: 35531021 Free PMC article. Review.
-
First record of biofluorescence in lumpfish (Cyclopterus lumpus), a commercially farmed cleaner fish.J Fish Biol. 2022 Oct;101(4):1058-1062. doi: 10.1111/jfb.15154. Epub 2022 Jul 23. J Fish Biol. 2022. PMID: 35781815 Free PMC article.
-
Controlled iris radiance in a diurnal fish looking at prey.R Soc Open Sci. 2018 Feb 21;5(2):170838. doi: 10.1098/rsos.170838. eCollection 2018 Feb. R Soc Open Sci. 2018. PMID: 29515824 Free PMC article.
-
Shining in the dark: First record of biofluorescence in the seahorse Hippocampus reidi.PLoS One. 2019 Aug 8;14(8):e0220561. doi: 10.1371/journal.pone.0220561. eCollection 2019. PLoS One. 2019. PMID: 31393893 Free PMC article.
-
Anatomical Analysis of the Retinal Specializations to a Crypto-Benthic, Micro-Predatory Lifestyle in the Mediterranean Triplefin Blenny Tripterygion delaisi.Front Neuroanat. 2017 Dec 12;11:122. doi: 10.3389/fnana.2017.00122. eCollection 2017. Front Neuroanat. 2017. PMID: 29311852 Free PMC article.
References
-
- Marshall J. Why are animals colourful? Sex and violence, seeing and signals. Colour Des Creativity. 2010;8:1–8.
-
- Maan ME, Seehausen O, Van Alphen JJM. Female mating preferences and male coloration covary with water transparency in a Lake Victoria cichlid fish. Biol J Linn Soc. 2010;99:398–406. doi: 10.1111/j.1095-8312.2009.01368.x. - DOI
LinkOut - more resources
Full Text Sources
Other Literature Sources
