. 2014 Feb;124(2):515-27.
doi: 10.1172/JCI67353. Epub 2014 Jan 9.

Interplay between FGF21 and insulin action in the liver regulates metabolism

Interplay between FGF21 and insulin action in the liver regulates metabolism

Brice Emanuelli et al. J Clin Invest. 2014 Feb.

Erratum in

Abstract

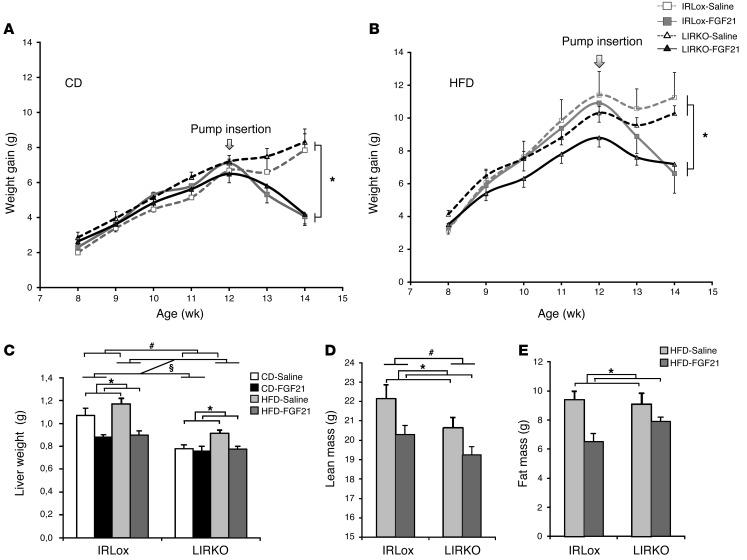
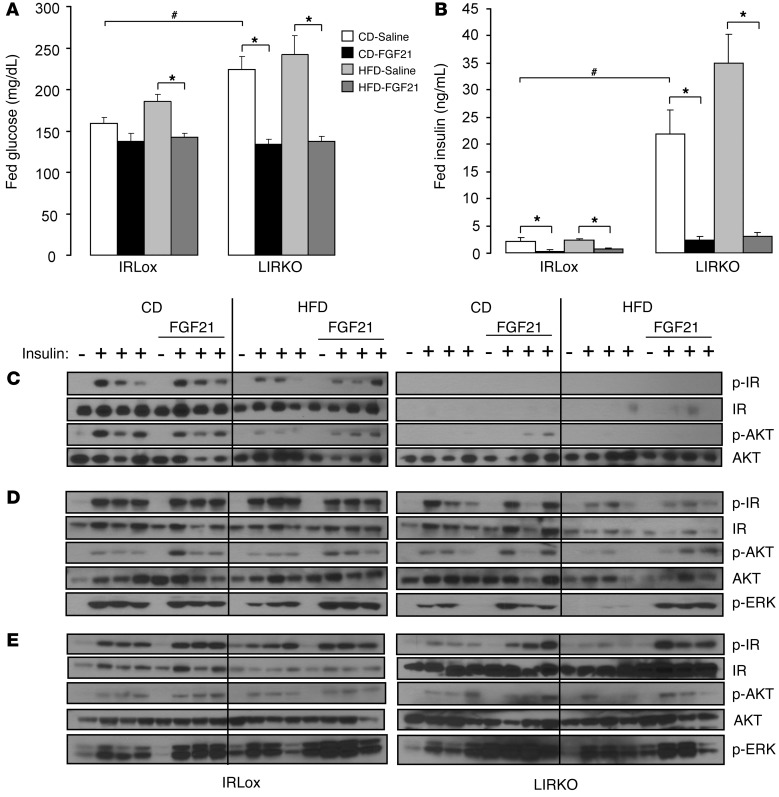
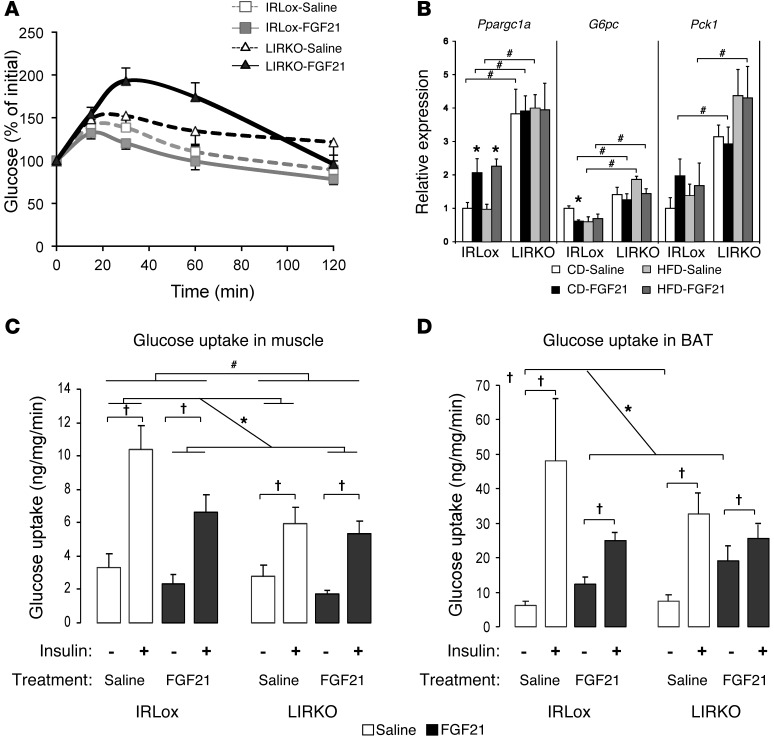
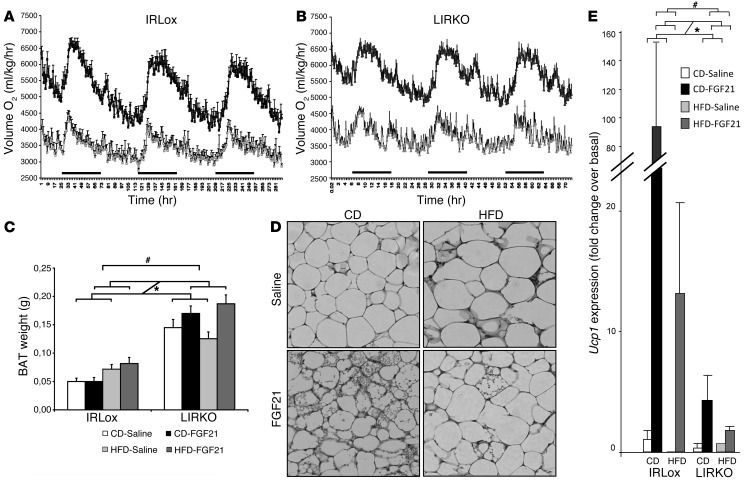
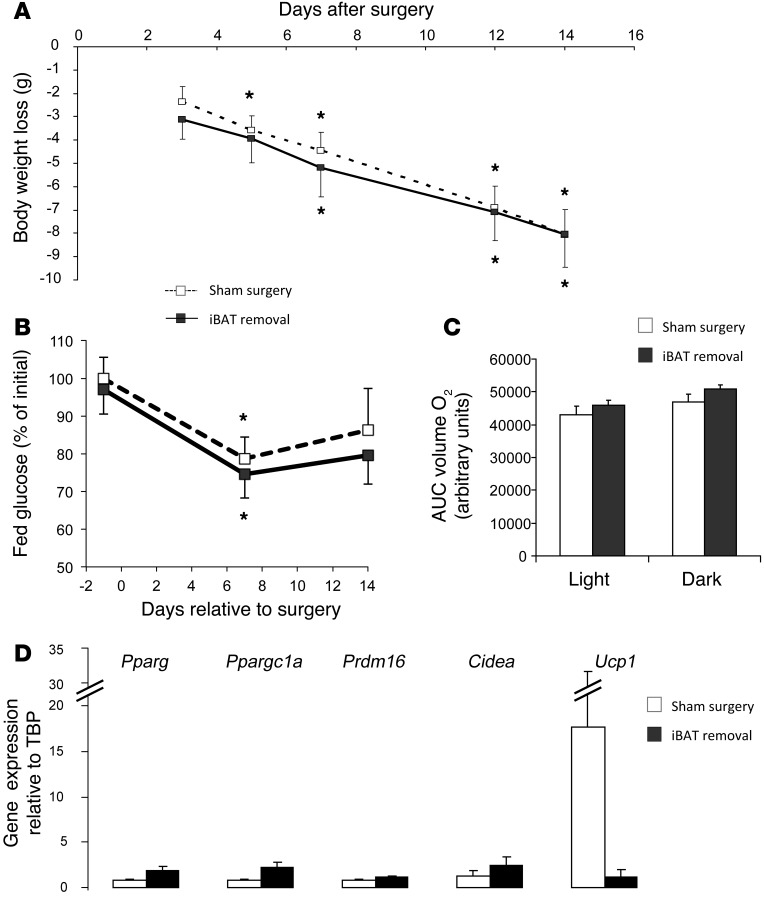
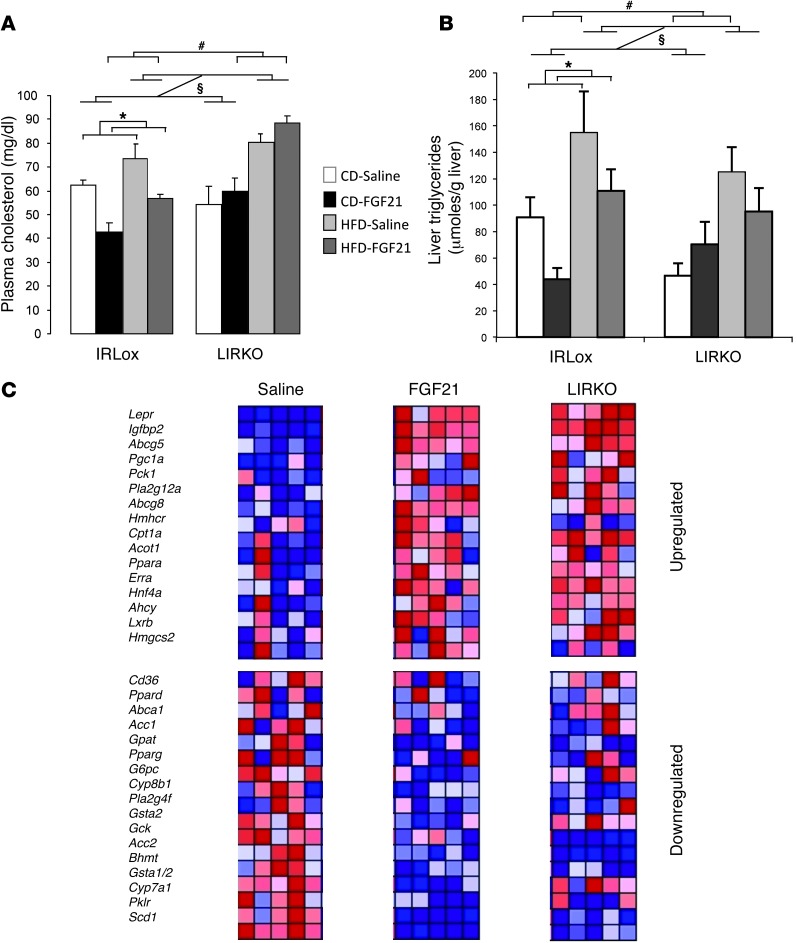
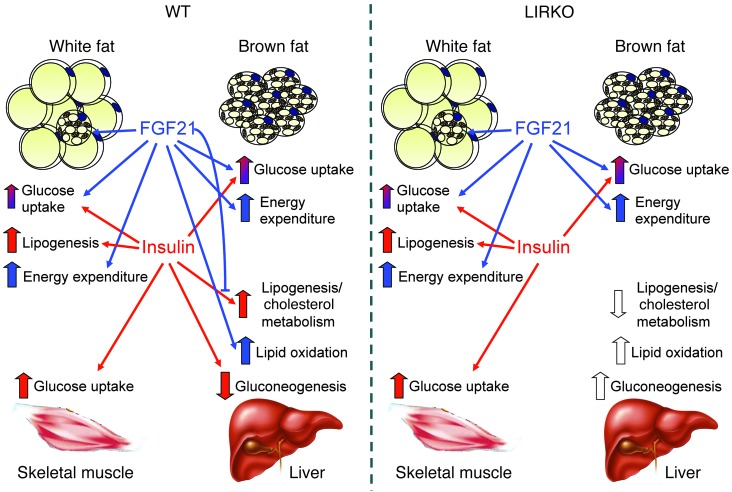
The hormone FGF21 regulates carbohydrate and lipid homeostasis as well as body weight, and increasing FGF21 improves metabolic abnormalities associated with obesity and diabetes. FGF21 is thought to act on its target tissues, including liver and adipose tissue, to improve insulin sensitivity and reduce adiposity. Here, we used mice with selective hepatic inactivation of the IR (LIRKO) to determine whether insulin sensitization in liver mediates FGF21 metabolic actions. Remarkably, hyperglycemia was completely normalized following FGF21 treatment in LIRKO mice, even though FGF21 did not reduce gluconeogenesis in these animals. Improvements in blood sugar were due in part to increased glucose uptake in brown fat, browning of white fat, and overall increased energy expenditure. These effects were preserved even after removal of the main interscapular brown fat pad. In contrast to its retained effects on reducing glucose levels, the effects of FGF21 on reducing circulating cholesterol and hepatic triglycerides and regulating the expression of key genes involved in cholesterol and lipid metabolism in liver were disrupted in LIRKO mice. Thus, FGF21 corrects hyperglycemia in diabetic mice independently of insulin action in the liver by increasing energy metabolism via activation of brown fat and browning of white fat, but intact liver insulin action is required for FGF21 to control hepatic lipid metabolism.


Figures

Figure 1
Figure 1. Effects of FGF21 on body and tissue weights.
Control and LIRKO mice were fed either a CD or an HFD for 7 weeks and were treated with saline or FGF21 (1 mg/kg/day) delivered s.c. by osmotic pump during the last 2 weeks of the diet. Body weight was measured once a week, and tissue weights were determined on day 14 after insertion of the pump. (A and B) Body weight gain of animals on a CD (A) or an HFD (B). Gray lines with squares represent control mice, black lines with triangles represent LIRKO mice, dashed lines represent saline-treated mice, and solid lines represent FGF21-treated mice. (C) Liver weight. White bars represent saline-treated mice on a CD, black bars represent FGF21-treated mice on a CD, light gray bars represent saline-treated mice on an HFD, and dark gray bars represent FGF21-treated mice on an HFD. (D and E) Lean mass (D) and fat mass (E) from DXA analysis. Light gray bars represent saline-treated mice on an HFD, and dark gray bars represent FGF21-treated mice on an HFD. Data represent the means ± SEM. P values were calculated using 2- or 3-way ANOVA. #P < 0.05 between genotypes; §P < 0.05 between diets; *P < 0.05 with FGF21 treatment. n = 5–12 animals per group.
Figure 2
Figure 2. Glycemia, insulinemia, and insulin signaling in mice treated with FGF21.
Control and LIRKO mice on a CD or an HFD for 7 weeks were treated with saline or FGF21 (1 mg/kg/day) delivered s.c. by osmotic pump during the last 2 weeks of the diet. Metabolic parameters (A and B) and insulin signaling (CE) were determined on day 14 after pump insertion. Data represent the means ± SEM. P values were determined by nonparametric statistical tests. #P < 0.05 between genotypes; *P < 0.05 with FGF21 treatment. White bars represent saline-treated mice on a CD, black bars represent FGF21-treated mice on a CD, light gray bars represent saline-treated mice on an HFD, and dark gray bars represent FGF21-treated mice on an HFD. (A) Fed glucose was reduced by 40% with FGF21 treatment (223.5 ± 16.1 mg/dl to 133.7 ± 5.9 mg/dl) in LIRKO mice on a CD and by 44% (242.8 ± 22.0 mg/dl to 137.7 ± 5.3 mg/dl) in LIRKO mice on an HFD. (B) Administration of FGF21 to LIRKO mice reduced insulin levels from 21.8 ± 4.5 ng/ml to 3 ± 0.7 ng/ml in mice on a CD and from 35 ± 5.4 ng/ml to 3 ± 0.7 ng/ml in mice on an HFD. n = 10–20 animals per group. (CE) Insulin signaling in vivo. Data shown are for 4 mice in each group of 5 to 7 animals. Total lysates obtained from liver (C), skeletal muscle (D), or s.c. adipose tissue (E) from control or LIRKO mice on a CD or an HFD and treated with saline or FGF21 before insulin injection were immunoblotted with various antibodies against insulin signaling molecules as indicated.
Figure 3
Figure 3. Effect of FGF21 on gluconeogenesis and glucose uptake in skeletal muscle and BAT.
Control and LIRKO mice on a CD or an HFD for 7 weeks were treated with saline or FGF21 (1 mg/kg/day) delivered s.c. by osmotic pump during the last 2 weeks of the diet. (A) Pyruvate challenge test. Gray lines with squares represent control mice; black lines with triangles represent LIRKO mice; dashed lines represent saline-treated mice; solid lines represent FGF21-treated mice. (B) Gene expression in liver was assessed by real-time qPCR. P value was determined by nonparametric tests. White bars represent saline-treated mice on a CD, black bars represent FGF21-treated mice on a CD, light gray bars represent saline-treated mice on an HFD, and dark gray bars represent FGF21-treated mice on an HFD. (C and D) In vivo glucose uptake was assessed by measuring [14C]DOG uptake in (C) skeletal muscle and (D) iBAT, with or without insulin stimulation, in animals on a CD. P value for D was determined by 3-way ANOVA. White bars represent saline treatment; black bars represent FGF21 treatment. Data represent the means ± SEM. #P < 0.05 between genotypes; *P < 0.05 with FGF21 treatment; §P < 0.05 upon insulin stimulation. n = 6–12 animals per group.
Figure 4
Figure 4. Energy homeostasis and BAT activation following chronic FGF21 treatment.
Control and LIRKO mice on a CD or an HFD for 7 weeks were treated with saline or FGF21 (1 mg/kg/day) delivered s.c. by osmotic pump during the last 2 weeks of the diet. CLAMS analysis was determined for 3 days, starting on day 7 after insertion of the pumps. (A and B) O2 consumption in control (A) and LIRKO (B) animals on an HFD. Gray lines represent saline-treated mice; black lines represent FGF21-treated mice. (C) BAT weight. White bars represent saline-treated mice on a CD, black bars represent FGF21-treated mice on a CD, light gray bars represent saline-treated mice on an HFD, and dark gray bars represent FGF21-treated mice on an HFD. (D) H&E staining of s.c. adipose tissue sections from LIRKO mice. Original magnification, ×40. (E) Ucp1 expression in s.c. adipose tissue determined by qPCR. Data represent the means ± SEM. P values were determined by 3-way ANOVA analysis.
Figure 5
Figure 5. FGF21 is still potent in mice lacking iBAT.
Control mice on an HFD for 12 weeks, with or without iBAT, were treated with FGF21 (1 mg/kg/day) delivered s.c. by osmotic pump during the last 2 weeks of the diet. Data represent the means ± SEM. n = 6–7 animals per group. *P < 0.05. (A) Weight loss following surgery and FGF21 treatment. P value was determined by 1-way ANOVA. (B) Glucose levels are represented as a percentage of initial glucose before surgery. Dashed lines represent animals with sham surgery; solid lines represent animals with surgical removal of iBAT. P value was calculated by a Student’s t test. (C) O2 consumption per animal measured by CLAMS. White bars represent mice with sham surgery, and black boxes represent mice without iBAT, during light or dark cycles. P value was calculated by a Student’s t test. (D) Gene expression in s.c. adipose tissue was assessed by real-time qPCR. White bars represent mice with sham surgery; black bars represent mice without iBAT. P value was calculated by a Student’s t test.
Figure 6
Figure 6. Lipid homeostasis and liver gene expression following FGF21 treatment.
Control and LIRKO mice on a CD or an HFD for 7 weeks were treated with saline or FGF21 (1 mg/kg/day) delivered s.c. by osmotic pump during the last 2 weeks of the diet. (A) Plasma cholesterol levels in the fed state. (B) Liver triglyceride content. Data represent the means ± SEM. P value was calculated using 2-way or 3-way ANOVA. #P < 0.05 between genotypes; §P < 0.05 between diets; *P < 0.05 with FGF21 treatment. White bars represent saline-treated mice on a CD, black boxes represent FGF21-treated mice on a CD, light gray bars represent saline-treated mice on an HFD, and dark gray bars represent FGF21-treated mice on an HFD. n = 5 to 11 animals per group. (C) Liver gene expression. The expression of selected genes was measured by qPCR, and heatmaps were generated using GenePattern software. Red color indicates upregulation; blue color indicates downregulation. Each lane represents an individual mouse.
Figure 7
Figure 7. Crosstalk between insulin and FGF21 for the regulation of metabolism.
Red arrows represent metabolic actions controlled by insulin, blue arrows represent metabolic actions regulated by FGF21, and white arrows represent the metabolic outcome induced by deletion of the IR. In LIRKO mice, insulin lost its ability to regulate glucose and lipid metabolism in the liver. In these mice, FGF21 maintained its ability to increase energy expenditure and regulate glucose homeostasis via adipose tissue, but lost its ability to regulate lipid metabolism due to a lack of interaction with insulin in liver.

References

    1. Haslam DW, James WP. Obesity. Lancet. 2005;366(9492):1197–1209. doi: 10.1016/S0140-6736(05)67483-1. - DOI - PubMed
    1. Danaei G, et al. National, regional, and global trends in fasting plasma glucose and diabetes prevalence since 1980: systematic analysis of health examination surveys and epidemiological studies with 370 country-years and 2.7 million participants. Lancet. 2011;378(9785):31–40. doi: 10.1016/S0140-6736(11)60679-X. - DOI - PubMed
    1. Reaven G, Abbasi F, McLaughlin T. Obesity, insulin resistance, and cardiovascular disease. Recent Prog Horm Res. 2004;59:207–223. doi: 10.1210/rp.59.1.207. - DOI - PubMed
    1. Haas JT, Biddinger SB. Dissecting the role of insulin resistance in the metabolic syndrome. Curr Opin Lipidol. 2009;20(3):206–210. doi: 10.1097/MOL.0b013e32832b2024. - DOI - PMC - PubMed
    1. Inzucchi SE, et al. Management of hyperglycaemia in type 2 diabetes: a patient-centered approach. Position statement of the American Diabetes Association (ADA) and the European Association for the Study of Diabetes (EASD). Diabetologia. 2012;55(6):1577–1596. doi: 10.1007/s00125-012-2534-0. - DOI - PubMed

Publication types