. 2014 Feb;124(2):742-54.
doi: 10.1172/JCI70198. Epub 2014 Jan 9.

MNK1 pathway activity maintains protein synthesis in rapalog-treated gliomas

MNK1 pathway activity maintains protein synthesis in rapalog-treated gliomas

Michal Grzmil et al. J Clin Invest. 2014 Feb.

Abstract

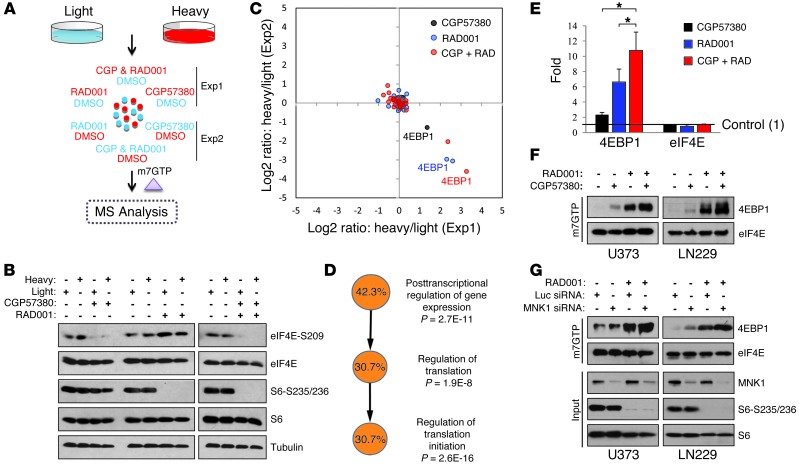
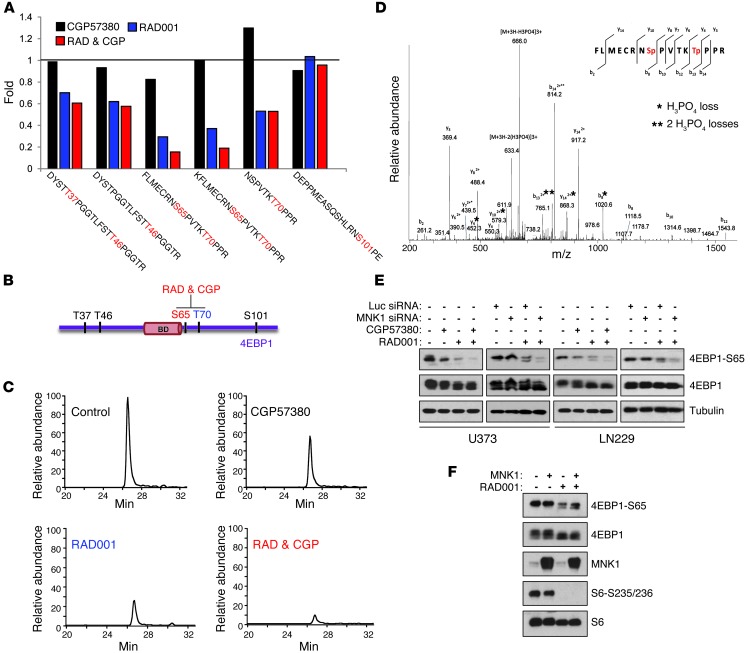
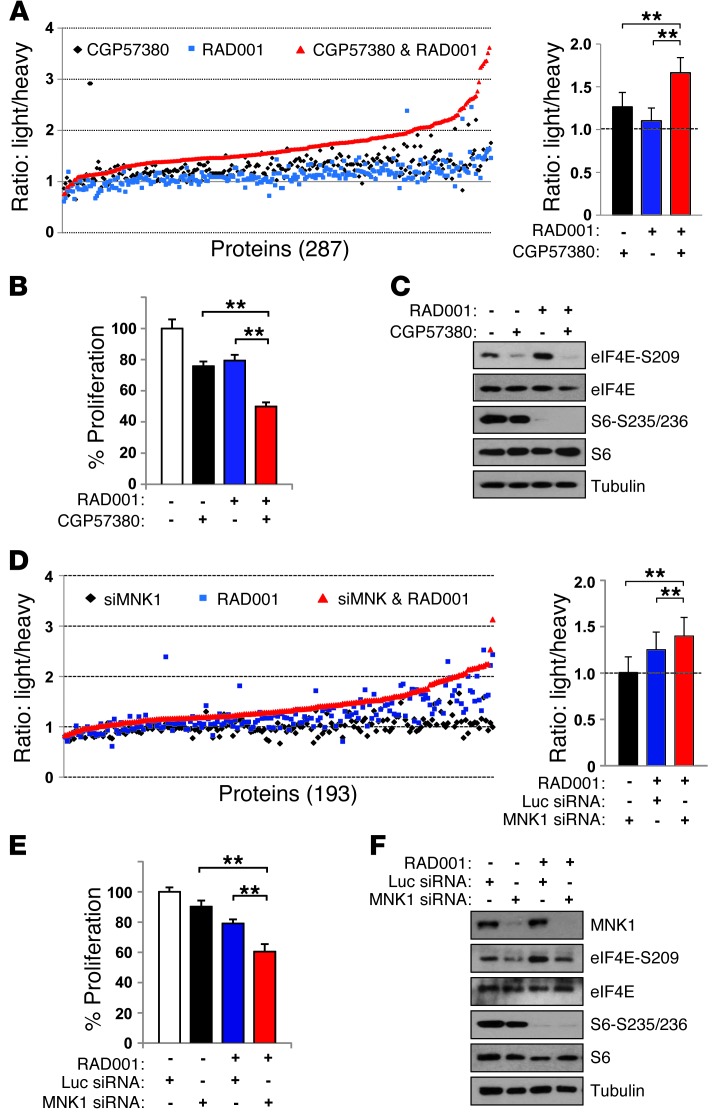
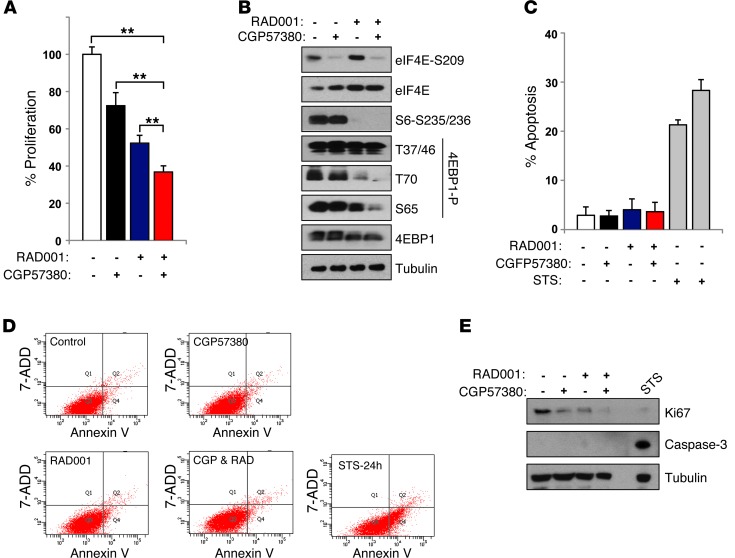
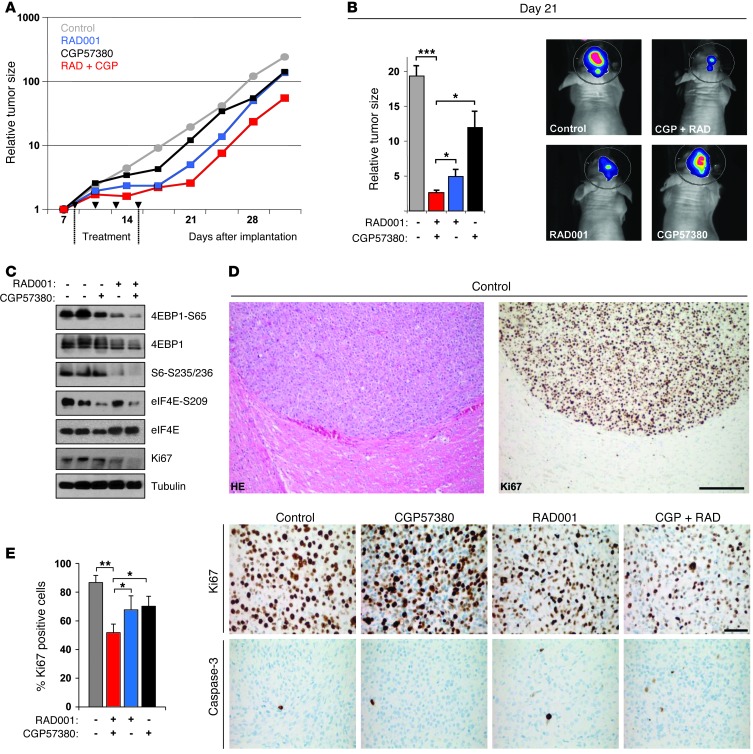
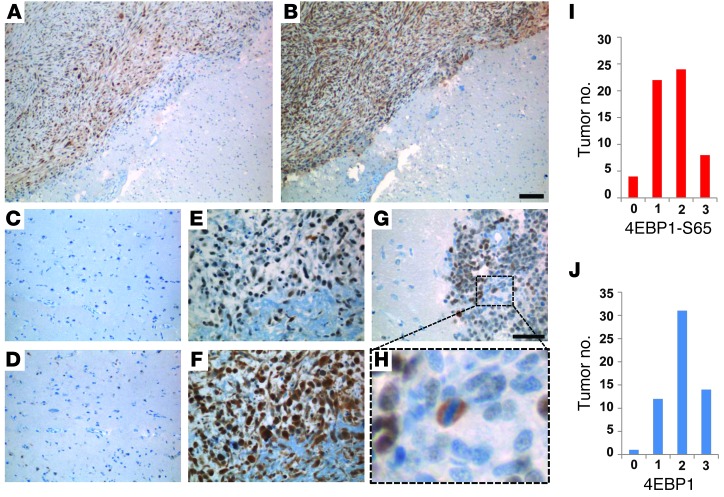
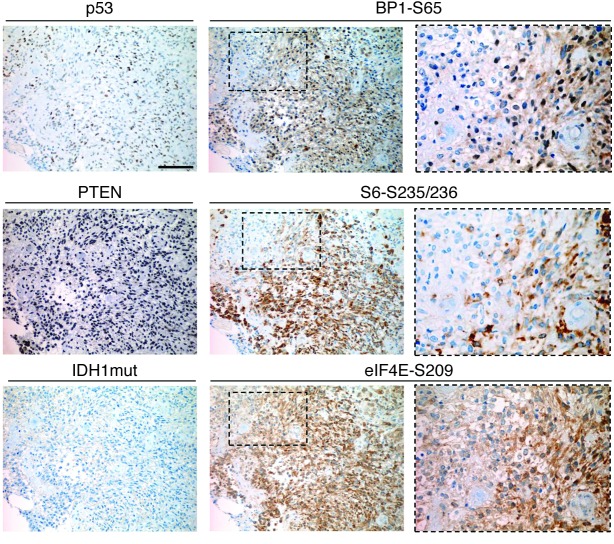
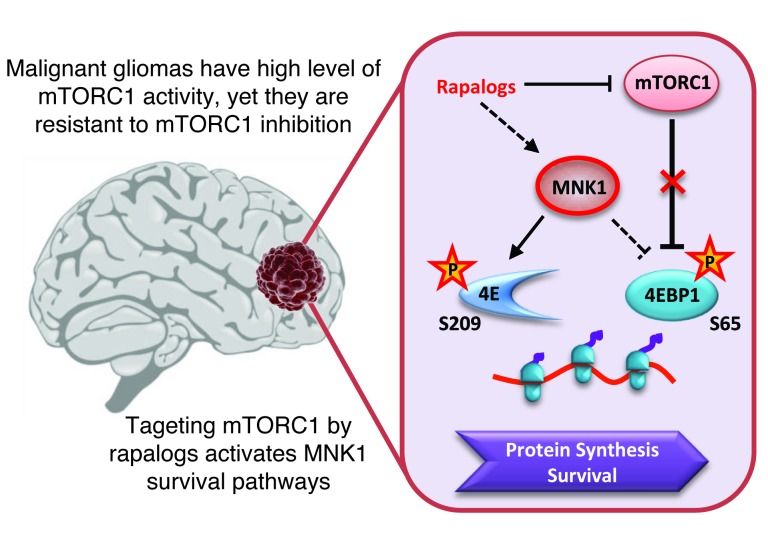
High levels of mammalian target of rapamycin complex 1 (mTORC1) activity in malignant gliomas promote tumor progression, suggesting that targeting mTORC1 has potential as a therapeutic strategy. Remarkably, clinical trials in patients with glioma revealed that rapamycin analogs (rapalogs) have limited efficacy, indicating activation of resistance mechanisms. Targeted depletion of MAPK-interacting Ser/Thr kinase 1 (MNK1) sensitizes glioma cells to the mTORC1 inhibitor rapamycin through an indistinct mechanism. Here, we analyzed how MNK1 and mTORC1 signaling pathways regulate the assembly of translation initiation complexes, using the cap analog m7GTP to enrich for initiation complexes in glioma cells followed by mass spectrometry-based quantitative proteomics. Association of eukaryotic translation initiation factor 4E (eIF4E) with eIF4E-binding protein 1 (4EBP1) was regulated by the mTORC1 pathway, whereas pharmacological blocking of MNK activity by CGP57380 or MNK1 knockdown, along with mTORC1 inhibition by RAD001, increased 4EBP1 binding to eIF4E. Furthermore, combined MNK1 and mTORC1 inhibition profoundly inhibited 4EBP1 phosphorylation at Ser65, protein synthesis and proliferation in glioma cells, and reduced tumor growth in an orthotopic glioblastoma (GBM) mouse model. Immunohistochemical analysis of GBM samples revealed increased 4EBP1 phosphorylation. Taken together, our data indicate that rapalog-activated MNK1 signaling promotes glioma growth through regulation of 4EBP1 and indicate a molecular cross-talk between the mTORC1 and MNK1 pathways that has potential to be exploited therapeutically.


Figures

Figure 1
Figure 1. Targeting MNK1 increases 4EBP1 association with eIF4E in RAD001-treated glioma cells.
(A) Experimental design — isotopically labeled (heavy, Exp1) or unlabeled (light, Exp2) U373 cells were treated with 10 μM CGP5730 and/or 10 nM RAD001 for 20 hours, and protein lysates were combined with lysates from DMSO-treated control cells as indicated and subjected to m7GTP-mediated precipitation of translation initiation complexes, followed by mass spectrometry (MS). (B) Phosphorylation of eIF4E and S6 ribosomal protein was monitored by immunoblotting using phospho-specific antibody. Blots were stripped and reprobed with eIF4E, S6, and tubulin to check for equal loading. (C) Protein abundance changes and (D) gene ontology analysis of precipitated protein complexes identified by mass spectrometry analysis. (E) Fold change of m7GTP-precipitated 4EBP1 and eIF4E proteins from inhibitor-treated cells compared with control cells incubated with DMSO. Data represent mean ± SD. *P < 0.05. (F) Western blot analysis of m7GTP precipitates from CGP5730- and/or RAD001-treated U373 and LN229 cells using 4EBP1- and eIF4E-specific antibodies. (G) Western blot analysis for 4EBP1 and eIF4E (as described above) of m7GTP precipitates from U373 and LN229 cells that were treated for 20 hours with 10 nM RAD001 24 hours after transfection with duplex siRNA oligonucleotides against MNK1 or control duplex against luciferase. MNK1 knockdown and the inhibition of S6 phosphorylation was confirmed using MNK1-, S6-, and phospho-S6-specific antibodies on whole protein lysates (input).
Figure 2
Figure 2. MNK1-dependent 4EBP1 phosphorylation at Ser65 in RAD001-treated glioma cells.
(A) LN229 cells were treated with 10 μM CGP5730 and/or 10 nM RAD001 for 2 hours, and 4EBP1 immunoprecipitated using a 4EBP1-specific antibody was analyzed by LC-MS/MS. Bars represent relative quantification of phosphopeptides. The abundance of each identified phosphopeptide in control DMSO-treated cells was set to 1. (B) Representation of the 4EBP1 protein showing phosphorylation sites affected by inhibitor treatment. BD, eIF4G binding domain. (C) Relative abundance and (D) MS2 spectra for peptides covering 4EBP1 phosphorylation sites at Ser65/Thr70. Detected y- and b-ions are indicated in the sequence and H3PO4 loss is marked with asterisks. (E) Phosphorylation of 4EBP1 at Ser65 was analyzed by immunoblotting using a phospho-specific antibody in whole protein lysates prepared from U373 and LN229 cells after 20 hours of treatment. Blots were stripped and reprobed with 4EBP1 and/or tubulin-specific antibodies. Twenty-four hours after transfection with duplex siRNA oligonucleotides against MNK1 or control duplex against luciferase, cells were treated with 10 nM RAD001 for a further 20 hours and lysates were subjected to Western blot analysis. (F) 4EBP1 phosphorylation in MNK1-overexpressing U373 cells 24 hours after transfection and treatment with 10 nM RAD001 was analyzed by immunoblotting as described above.
Figure 3
Figure 3. Concomitant targeting of mTORC1 and MNK1 increases inhibition of protein synthesis.
(A and D) Bulk protein synthesis in LN229 cells (A) incubated with 10 μM CGP5730 and/or with 10 nM RAD001 or (D) 48 hours after transfection with siRNA against MNK1 or with a control duplex against luciferase and/or with 10 nM RAD001, as measured by heavy lysine and arginine incorporation during an 8-hour SILAC-labeling period and mass spectrometry–based analysis. Graph points represent ratios of light- to heavy-labeled proteins for each protein identified from treated and/or transfected cells. The ratios in control (A) DMSO-treated and (D) luciferase-transfected cells were set to 1. Averages of light-to-heavy ratios ± SD for all identified proteins are also shown. (B and E) An MTT-based assay for LN229 cell proliferation (B) 3 days after treatment with 10 μM CGP57380 and/or incubation with 10 nM RAD001 or (E) after transfection with siRNA against MNK1 or luciferase control duplex and/or incubation with 10 nM RAD001. Results were assayed in triplicate and are shown as percentage proliferation compared with control cells. Data represent mean ± SD. (C) Phosphorylation of S6, eIF4E, and (F) MNK1 knockdown was monitored by Western blot analysis. For equal loading control blots were stripped and reprobed with eIF4E-, S6-, and tubulin-specific antibodies. **P < 0.01.
Figure 4
Figure 4. Inhibition of proliferation and 4EBP1 phosphorylation in RAD001- and CGP57380-treated cells.
U87MG-luc cells were treated with 10 μM CGP57380 and/or with 10 nM RAD001 for 3 days. (A) MTT-based proliferation assays were performed in triplicate, and the results are shown as percentage proliferation compared with control DMSO-treated cells. Data represent mean ± SD. **P < 0.01. (B) Phosphorylation of 4EBP1, eIF4E, and S6 protein was analyzed by immunoblotting using phospho-specific antibodies. For equal loading, blots were probed with antibodies against total eIF4E, 4EBP1, and tubulin. (C) Apoptosis was assessed in triplicate by annexin V and 7-ADD staining followed by flow cytometry, and percentage apoptosis is shown as percentage of annexin V–positive cells. Data represent mean ± SD. Cells incubated with 1 μM staurosporine (STS) for 16 and 24 hours were used as a positive control. (D) Dot plots are displayed with annexin V and 7-ADD staining. Lower- and upper-right quadrants represent early and late apoptotic cells, respectively. (E) Western blot analysis for Ki67 and cleaved caspase-3 in treated cells, as described above. Tubulin was used as a loading control.
Figure 5
Figure 5. Concomitant treatment with CGP57380 and RAD001 inhibits tumor growth in vivo.
(A) Growth curves for an orthotopic GBM xenograft nude mouse model. U87MG-luc glioma cells were implanted into the brains of immunocompromised (nude) mice. Compound-treated and control animal groups (n = 5) received 4 injections of CGP57380 or/and RAD001 between days 8 and 15 after implantation as indicated by black triangles, and tumor growth was monitored and analyzed by noninvasive BLI over a period of 31 days. (B) Relative tumor size 21 days after implantation and representative BLI images for treated and control animals. Data represent mean ± SD. (C) Phosphorylation of 4EBP1, eIF4E, and S6 protein and Ki67 expression analyzed by immunoblotting in brain tumors from control and treated mice dissected 1 day after the final injection, as described above. (D) H&E staining and IHC for Ki67 and cleaved caspase-3 in control and treated brain tumors. Scale bars 50 μm (top); 200 μm (bottom). (E) The percentage of Ki67-positive cells was determined by counting stained cells in the treated tumors. Bars represent mean ± SD. *P < 0.05, **P < 0.01, ***P < 0.001.
Figure 6
Figure 6. Increased 4EBP1 phosphorylation at Ser65 in GBM samples.
Immunostaining (A, C, E, G, and H) for phosphorylated 4EBP1 at Ser65 and (B, D, and F) for total 4EBP1. (C and D) GBM samples and normal control brain samples were stained with specific monoclonal antibodies (brown) and counterstained with hematoxylin (blue). (H) Higher-magnification view of the boxed region in G, showing an increased signal for phospho-4EBP1 in mitotic cells (original magnification, ×400). Scale bar: 50 μm (A and B); 100 μm (CG). Immunohistological scoring of (I) phospho-4EBP1 and (J) total 4EBP1 in 58 primary GBM samples.
Figure 7
Figure 7. Phosphorylation of 4EBP1, S6, and eIF4E in GBM samples.
Immunostaining for p53, PTEN, and IDH1 R132H mutant as well as for phosphorylated 4EBP1, ribosomal protein S6, and eIF4E was accomplished using specific monoclonal antibodies (brown) in the corresponding tumor areas. Hematoxylin (blue) was used for counterstaining. Higher-magnification views of the boxed regions in the center column are shown in the right column (original magnification, ×200). Scale bar: 100 μm (left and center columns).
Figure 8
Figure 8. Model of MNK1-mediated resistance to rapalogs.
Rapalogs abrogate mTORC1-mediated inhibition of 4EBP1 phosphorylation at Ser65 and Thr70. Activated by rapalogs, the MNK1 signaling pathway phosphorylates eIF4E and maintains 4EBP1 phosphorylation at Ser65. Activation of the MNK1/eIF4E pathway increases translation of cancer-promoting and antiapoptotic proteins, whereas 4EBP1 phosphorylation followed by eIF4E dissociation allows continued protein synthesis and, thus, cancer cell survival.

Similar articles

Cited by

References

    1. Cancer Genome Atlas Research Network. Comprehensive genomic characterization defines human glioblastoma genes and core pathways. Nature. 2008;455(7216):1061–1068. doi: 10.1038/nature07385. - DOI - PMC - PubMed
    1. Akhavan D, Cloughesy TF, Mischel PS. mTOR signaling in glioblastoma: lessons learned from bench to bedside. Neuro Oncol. 2010;12(8):882–889. doi: 10.1093/neuonc/noq052. - DOI - PMC - PubMed
    1. Houchens DP, Ovejera AA, Riblet SM, Slagel DE. Human brain tumor xenografts in nude mice as a chemotherapy model. Eur J Cancer Clin Oncol. 1983;19(6):799–805. doi: 10.1016/0277-5379(83)90012-3. - DOI - PubMed
    1. Chang SM, et al. Phase II study of CCI-779 in patients with recurrent glioblastoma multiforme. Invest New Drugs. 2005;23(4):357–361. doi: 10.1007/s10637-005-1444-0. - DOI - PubMed
    1. Galanis E, et al. Phase II trial of temsirolimus (CCI-779) in recurrent glioblastoma multiforme: a North Central Cancer Treatment Group Study. J Clin Oncol. 2005;23(23):5294–5304. doi: 10.1200/JCO.2005.23.622. - DOI - PubMed

Publication types

MeSH terms