. 2014 Feb;141(3):585-93.
doi: 10.1242/dev.098632. Epub 2014 Jan 8.

High-resolution imaging of cardiomyocyte behavior reveals two distinct steps in ventricular trabeculation

Affiliations

High-resolution imaging of cardiomyocyte behavior reveals two distinct steps in ventricular trabeculation

David W Staudt et al. Development. 2014 Feb.

Abstract

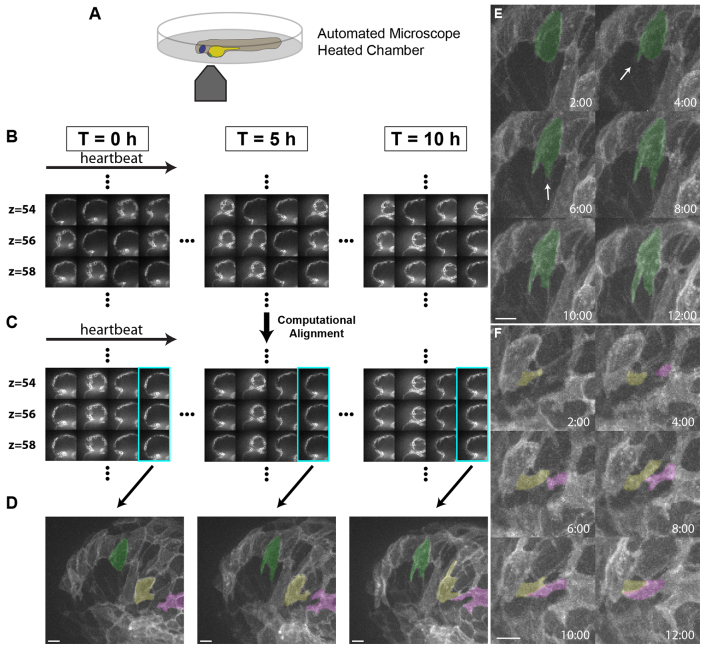
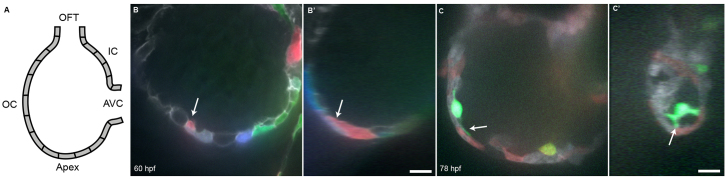
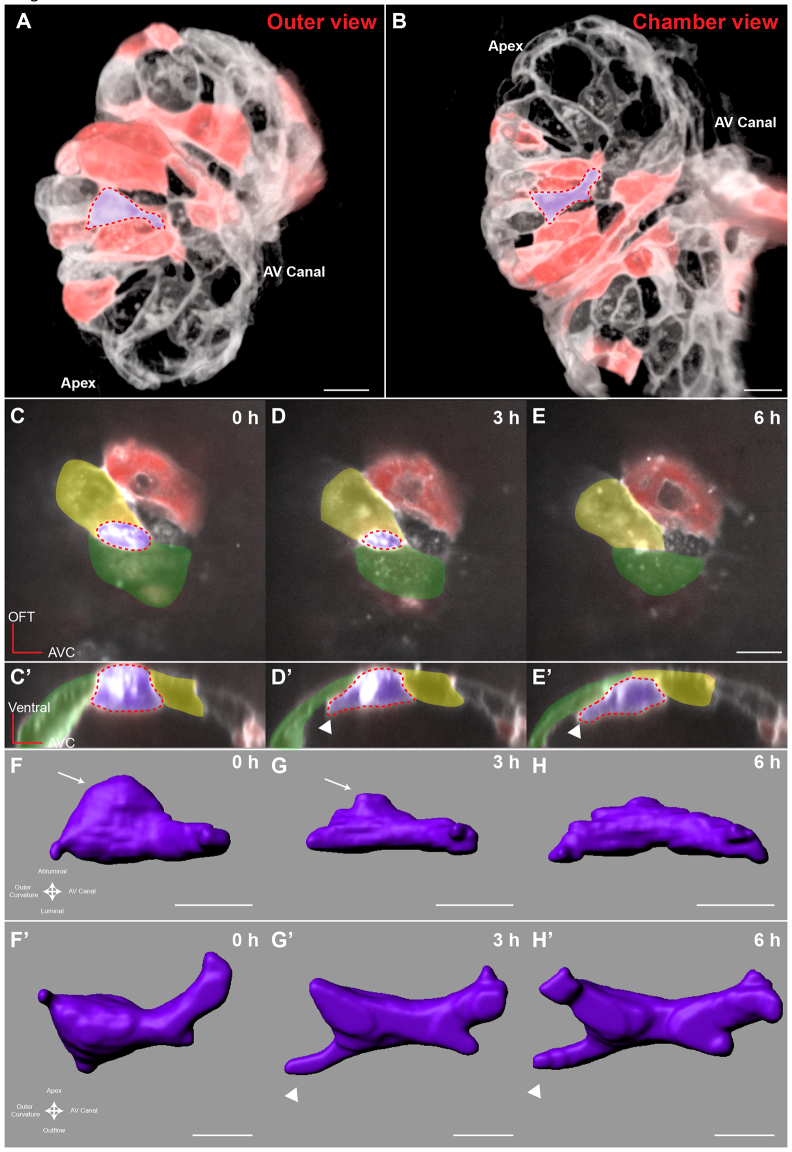
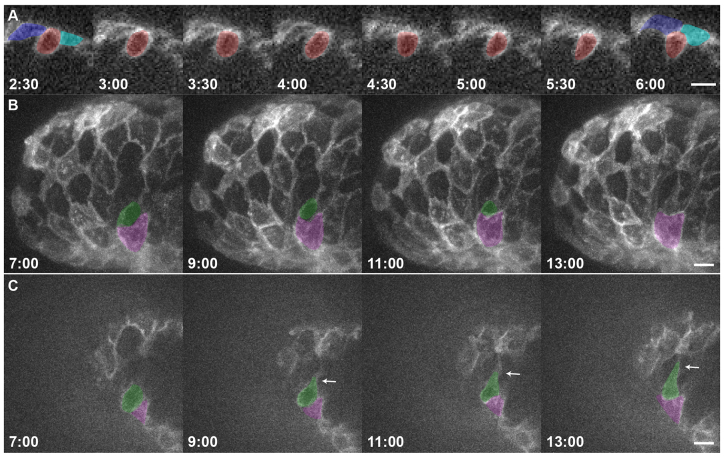
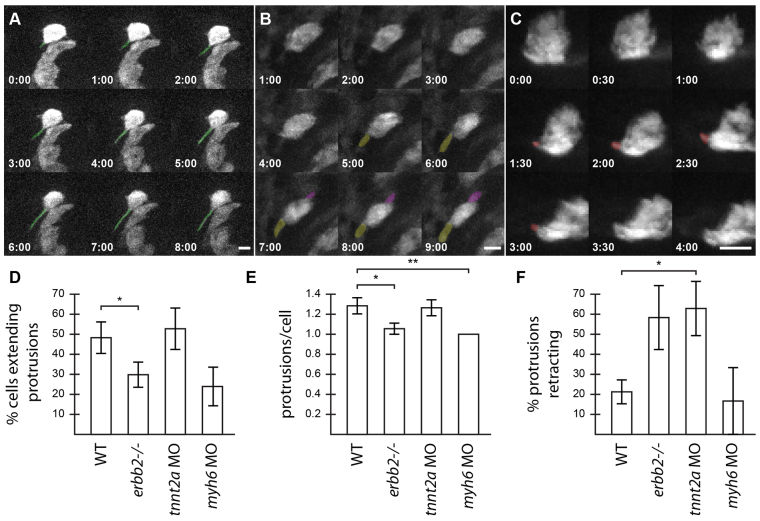
Over the course of development, the vertebrate heart undergoes a series of complex morphogenetic processes that transforms it from a simple myocardial epithelium to the complex 3D structure required for its function. One of these processes leads to the formation of trabeculae to optimize the internal structure of the ventricle for efficient conduction and contraction. Despite the important role of trabeculae in the development and physiology of the heart, little is known about their mechanism of formation. Using 3D time-lapse imaging of beating zebrafish hearts, we observed that the initiation of cardiac trabeculation can be divided into two processes. Before any myocardial cell bodies have entered the trabecular layer, cardiomyocytes extend protrusions that invade luminally along neighboring cell-cell junctions. These protrusions can interact within the trabecular layer to form new cell-cell contacts. Subsequently, cardiomyocytes constrict their abluminal surface, moving their cell bodies into the trabecular layer while elaborating more protrusions. We also examined the formation of these protrusions in trabeculation-deficient animals, including erbb2 mutants, tnnt2a morphants, which lack cardiac contractions and flow, and myh6 morphants, which lack atrial contraction and exhibit reduced flow. We found that, compared with cardiomyocytes in wild-type hearts, those in erbb2 mutants were less likely to form protrusions, those in tnnt2a morphants formed less stable protrusions, and those in myh6 morphants extended fewer protrusions per cell. Thus, through detailed 4D imaging of beating hearts, we have identified novel cellular behaviors underlying cardiac trabeculation.

Keywords: Cardiac cell biology; Live imaging; Morphogenesis; Trabeculation; Zebrafish; erbb2.


Figures

Fig. 1.
Fig. 1.
Live imaging reveals the dynamics of cardiomyocyte protrusions. (A) Zebrafish embryos at 55-60 hpf were imaged in glass plates on an automated, inverted microscope equipped with a spinning disk. (B-D) Steps in the data processing pipeline. The three columns show datasets acquired from the same embryo at the indicated time points after the start of imaging. (B) Data are initially acquired as unsynchronized z-stacks of movies. Frames from three sequential z-slices are shown. Note that the rows (z-slices) are unsynchronized. (C) Frames following computational alignment: sequences from each z-slice are temporally registered (e.g. delayed or advanced) to match those in other z-slices and developmental stages. The turquoise box contains the frame during ventricular relaxation that is used for further analysis. (D) Maximum intensity z-projections of the relaxed ventricle from the three developmental time points. Individual cardiomyocytes are pseudocolored green, magenta and yellow. Note the dramatic cell shape changes that can be observed after computational alignment. (E) Time-lapse images of cellular protrusions. A cardiomyocyte extending protrusions is marked in green. Arrows point to the emerging protrusions. (F) Time-lapse images of two protrusions, highlighted in yellow and purple, extending towards each other. The two protrusions appear to form a cell-cell junction by 12 hours of imaging. Scale bars: 10 μm.
Fig. 2.
Fig. 2.
Cardiomyocytes extend protrusions luminally while still in the compact layer. (A) Illustration of the orientation of the hearts shown in B and C. (B) Optical slice of a 60 hpf Tg(myl7:ras-GFP) heart with cardiomyocytes marked with multiple fluorescent proteins. Arrow points to a marked cellular protrusion (red), extending over another marked cardiomyocyte (purple). (B′) View of the same dataset as B rotated 90°, showing that this protrusion extends from a cardiomyocyte that is still mostly contained within the compact layer. (C) Optical slice of a 78 hpf Tg(myl7:EGFP) heart similarly marked with multiple fluorescent proteins. Arrow points to a protrusion extending from a trabecular cardiomyocyte (green). (C′) View of the same dataset as C rotated 90°, showing that the same cardiomyocyte extends multiple protrusions. AVC, atrioventricular canal; IC, inner curvature; OC, outer curvature; OFT, outflow tract. Scale bars: 10 μm.
Fig. 3.
Fig. 3.
Cardiomyocytes show evidence of abluminal constriction. (A) 3D exterior view of a 72 hpf Tg(myl7:ras-GFP) heart with a subset of cardiomyocytes randomly labeled with RFP. Membrane GFP signal is pseudocolored white, and mosaically marked cardiomyocytes are in red. A cardiomyocyte of interest is highlighted in purple. (B) Interior chamber view of the same heart. Cardiomyocyte of interest is highlighted in purple. (C-E) Time-lapse highlighting a cardiomyocyte of interest in another heart. A single xy plane is shown at the start of imaging (C), at +3 hours of imaging (D), and at +6 hours of imaging (E). Orientation is as in A. Dotted lines outline the gradually constricting cell contact with the abluminal surface. The neighboring cardiomyocytes are highlighted in yellow and green. In E, the cardiomyocyte has lost contact with the abluminal surface and thus can no longer be seen. (C′-E′) Re-slice of the confocal stack showing the same cardiomyocyte rotated 90°. Cardiomyocyte of interest is highlighted in purple, and neighboring cardiomyocytes are in yellow and green. The cardiomyocyte can be seen extending a protrusion (arrowheads) as it exits the compact layer. (F-H) 3D volume rendering of the highlighted cardiomyocyte. Arrows point to contracting contact with the abluminal surface. Arrowheads point to the extending protrusion shown in E′. (F′-H′) 90° rotation of F-H showing luminal view of the cardiomyocyte. Scale bars: 10 μm in A-E; 5 μm in F-H′.
Fig. 4.
Fig. 4.
Cardiomyocytes extend protrusions while constricting their abluminal surface. (A) Transverse section of a Tg(myl7:ras-GFP) heart imaged starting at 60 hpf showing a cardiomyocyte entering the trabecular layer (red). The neighboring cardiomyocytes are marked in blue and cyan at the beginning and end of the movie. Note the increase over time in Tg(myl7:ras-GFP) signal abluminal to the marked cardiomyocyte. This increase appears to be caused by the movement of neighboring cardiomyocytes. (B) 3D projection of a Tg(myl7:ras-GFP) heart imaged starting at 59 hpf. Time from start of imaging (hours:minutes) is shown on lower left. The cardiomyocyte marked in green constricts its abluminal surface. This cardiomyocyte completely exits the compact layer by 13 hours of imaging. The cardiomyocyte marked in purple changes shape to take up part of the space vacated by the green cardiomyocyte. (C) Drift-corrected (see Materials and Methods) optical slice 15 μm from the abluminal surface of the heart shown in B. Green and purple cardiomyocytes from B are marked accordingly. The green cardiomyocyte extends a protrusion luminally (arrows). Scale bars: 10 μm.
Fig. 5.
Fig. 5.
Trabecular-deficient animals exhibit different modes of trabecular failure. (A-C) Examples of distinct cardiomyocyte behavior: (A) a cardiomyocyte extending a single protrusion (green); (B) a cardiomyocyte extending two protrusions (purple and yellow); and (C) a cardiomyocyte extending a protrusion which then retracts over the next 2 hours (red). Scale bars: 10 μm. (D-F) Quantification of the properties and behavior of myocardial protrusions in trabecular-deficient backgrounds. Error bars indicate s.e.m. Data were collected from 97 WT cells (14 embryos, 59 processes), 40 tnnt2a morphant cells (seven embryos, 32 processes), 37 erbb2 mutant cells (six embryos, 14 processes) and 20 amhc morphant cells (four embryos, eight processes). (D) The number of cardiomyocytes extending protrusions as a proportion of the total number of cardiomyocytes counted. (E) The number of protrusions per cardiomyocyte that extended at least one protrusion. (F) The number of protrusions that retracted in length during a 10-hour movie, as a proportion of the total number of protrusions observed in each set of embryos. *P<0.05, **P<0.005. WT, wild type.

References

    1. Auman H. J., Coleman H., Riley H. E., Olale F., Tsai H. J., Yelon D. (2007). Functional modulation of cardiac form through regionally confined cell shape changes. PLoS Biol. 5, e53 - PMC - PubMed
    1. Balciunas D., Wangensteen K. J., Wilber A., Bell J., Geurts A., Sivasubbu S., Wang X., Hackett P. B., Largaespada D. A., McIvor R. S., et al. (2006). Harnessing a high cargo-capacity transposon for genetic applications in vertebrates. PLoS Genet. 2, e169 - PMC - PubMed
    1. Bartman T., Walsh E. C., Wen K. K., McKane M., Ren J., Alexander J., Rubenstein P. A., Stainier D. Y. R. (2004). Early myocardial function affects endocardial cushion development in zebrafish. PLoS Biol. 2, E129 - PMC - PubMed
    1. Beis D., Stainier D. Y. R. (2006). In vivo cell biology: following the zebrafish trend. Trends Cell Biol. 16, 105–112 - PubMed
    1. Berdougo E., Coleman H., Lee D. H., Stainier D. Y. R., Yelon D. (2003). Mutation of weak atrium/atrial myosin heavy chain disrupts atrial function and influences ventricular morphogenesis in zebrafish. Development 130, 6121–6129 - PubMed

Publication types

MeSH terms

LinkOut - more resources