

Climate and environmental change drives Ixodes ricinus geographical expansion at the northern range margin
- PMID: 24401487
- PMCID: PMC3895670
- DOI: 10.1186/1756-3305-7-11
Climate and environmental change drives Ixodes ricinus geographical expansion at the northern range margin
Abstract
Background: Global environmental change is causing spatial and temporal shifts in the distribution of species and the associated diseases of humans, domesticated animals and wildlife. In the on-going debate on the influence of climate change on vectors and vector-borne diseases, there is a lack of a comprehensive interdisciplinary multi-factorial approach utilizing high quality spatial and temporal data.
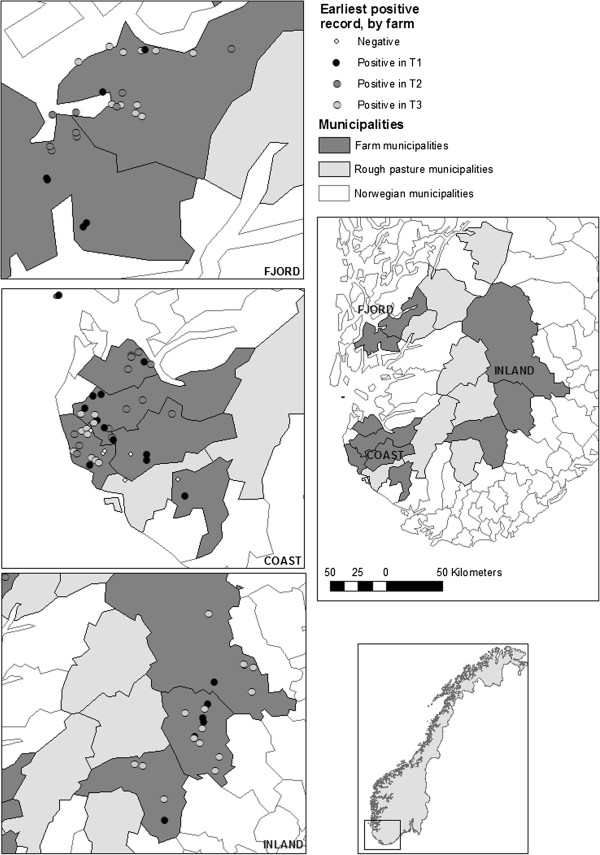
Methods: We explored biotic and abiotic factors associated with the latitudinal and altitudinal shifts in the distribution of Ixodes ricinus observed during the last three decades in Norway using antibodies against Anaplasma phagocytophilum in sheep as indicators for tick presence. Samples obtained from 2963 sheep from 90 farms in 3 ecologically different districts during 1978 - 2008 were analysed. We modelled the presence of antibodies against A. phagocytophilum to climatic-, environmental and demographic variables, and abundance of wild cervids and domestic animals, using mixed effect logistic regressions.
Results: Significant predictors were large diurnal fluctuations in ground surface temperature, spring precipitation, duration of snow cover, abundance of red deer and farm animals and bush encroachment/ecotones. The length of the growth season, mean temperature and the abundance of roe deer were not significant in the model.
Conclusions: Our results highlight the need to consider climatic variables year-round to disentangle important seasonal variation, climatic threshold changes, climate variability and to consider the broader environmental change, including abiotic and biotic factors. The results offer novel insight in how tick and tick-borne disease distribution might be modified by future climate and environmental change.
Figures

References
-
- Randolph SE. Tick ecology: processes and patterns behind the epidemiological risk posed by ixodid ticks as vectors. Parasitology. 2004;129(Suppl):S37–S65. - PubMed
-
- Macleod JAJ. The binomics of Ixodes ricinus L.,the “sheep tick” of Scotland. Parasitology. 1932;24:382–400. doi: 10.1017/S0031182000020795. - DOI
Publication types
MeSH terms
LinkOut - more resources
Full Text Sources
Other Literature Sources
