

Comprehensive analysis of miRNA expression in T-cell subsets of rheumatoid arthritis patients reveals defined signatures of naive and memory Tregs
- PMID: 24401767
- PMCID: PMC3959220
- DOI: 10.1038/gene.2013.69
Comprehensive analysis of miRNA expression in T-cell subsets of rheumatoid arthritis patients reveals defined signatures of naive and memory Tregs
Abstract
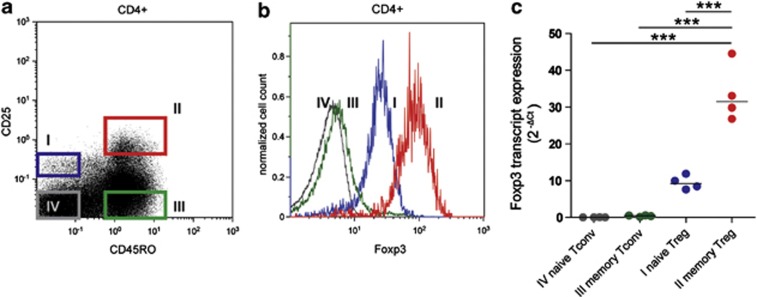
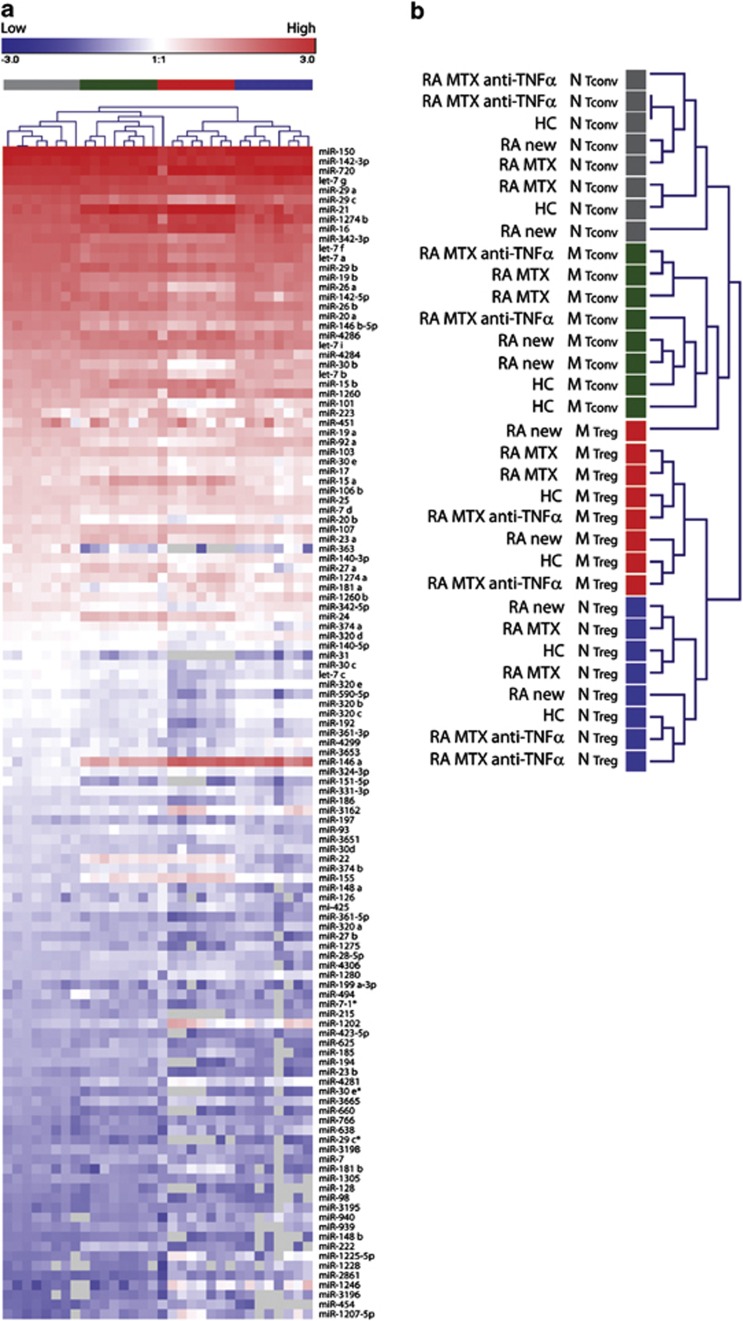
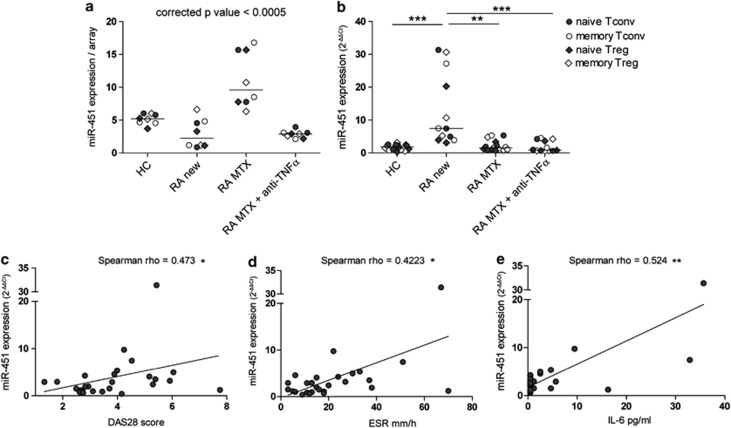
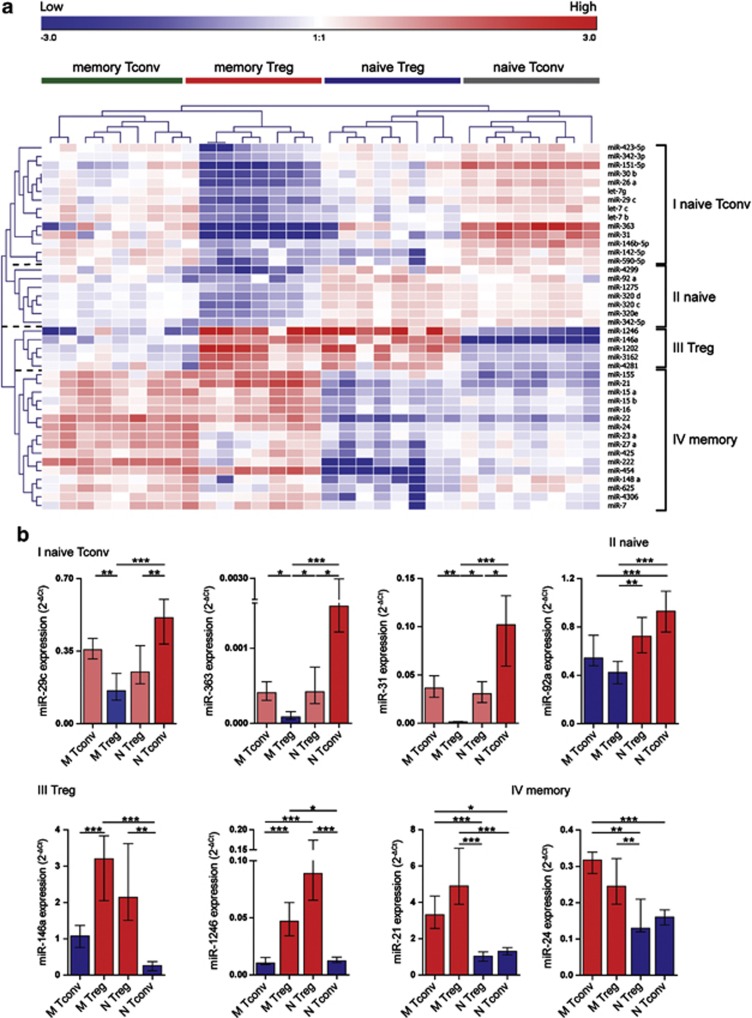
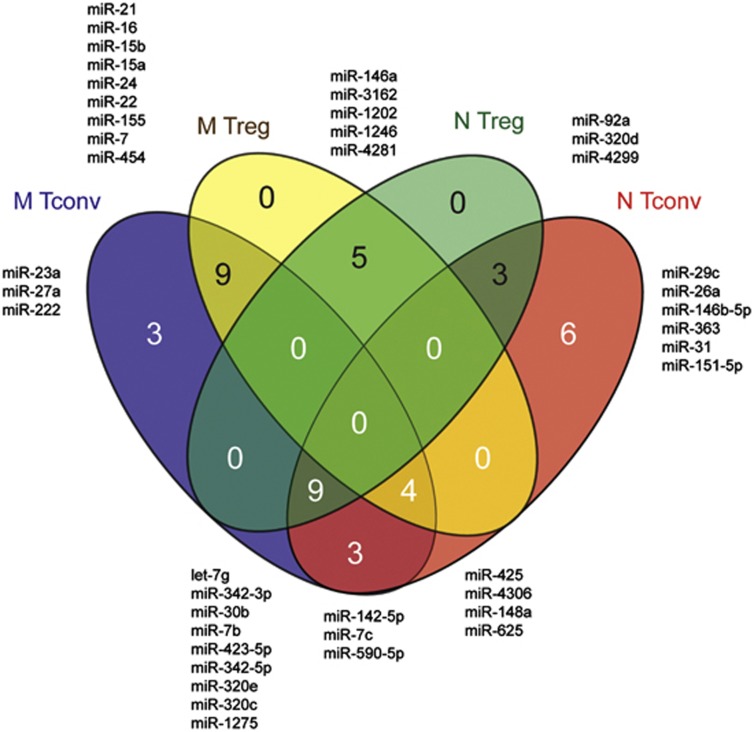
Disturbed expression of microRNAs (miRNAs) in regulatory T cells (Tregs) leads to development of autoimmunity in experimental mouse models. However, the miRNA expression signature characterizing Tregs of autoimmune diseases, such as rheumatoid arthritis (RA) has not been determined yet. In this study, we have used a microarray approach to comprehensively analyze miRNA expression signatures of both naive Tregs (CD4+CD45RO-CD25++) and memory Tregs (CD4+CD45RO+CD25+++), as well as conventional naive (CD4+CD45RO-CD25-) and memory (CD4+CD45RO+CD25-) T cells (Tconvs) derived from peripheral blood of RA patients and matched healthy controls. Differential expression of selected miRNAs was validated by TaqMan-based quantitative reverse transcription-PCR. We found a positive correlation between increased expression of miR-451 in T cells of RA patients and disease activity score (DAS28), erythrocyte sedimentation rate levels and serum levels of interleukin-6. Moreover, we found characteristic, disease- and treatment-independent, global miRNA expression signatures defining naive Tregs, memory Tregs, naive Tconvs and memory Tconvs. The analysis allowed us to define miRNAs characteristic for a general naive phenotype (for example, miR-92a) and a general memory phenotype (for example, miR-21, miR-155). Importantly, the analysis allowed us to define miRNAs that are specifically expressed in both naive and memory Tregs, defining as such miRNA signature characterizing the Treg phenotype (that is, miR-146a, miR-3162, miR-1202, miR-1246 and miR-4281).
Figures
Similar articles
-
A modified flow cytometry method for objective estimation of human CD4+ regulatory T cells (CD4+ Tregs) in peripheral blood, via CD4/CD25/CD45RO/FoxP3 labeling.Cytometry B Clin Cytom. 2020 May;98(3):259-269. doi: 10.1002/cyto.b.21841. Epub 2019 Sep 30. Cytometry B Clin Cytom. 2020. PMID: 31571372
-
Decreased expression of miR-146a and miR-155 contributes to an abnormal Treg phenotype in patients with rheumatoid arthritis.Ann Rheum Dis. 2015 Jun;74(6):1265-74. doi: 10.1136/annrheumdis-2013-204377. Epub 2014 Feb 21. Ann Rheum Dis. 2015. PMID: 24562503
-
[Increased percentage and defective inhibitory function of CD4+CD25-FOXP3+ T cells in synovial fluid of patients with rheumatoid arthritis].Xi Bao Yu Fen Zi Mian Yi Xue Za Zhi. 2019 Nov;35(11):961-966. Xi Bao Yu Fen Zi Mian Yi Xue Za Zhi. 2019. PMID: 31878990 Chinese.
-
The Proportion of Regulatory T Cells in Patients with Rheumatoid Arthritis: A Meta-Analysis.PLoS One. 2016 Sep 13;11(9):e0162306. doi: 10.1371/journal.pone.0162306. eCollection 2016. PLoS One. 2016. PMID: 27622457 Free PMC article.
-
MiR-146a levels in rheumatoid arthritis and their correlation with disease activity: a meta-analysis.Int J Rheum Dis. 2018 Jul;21(7):1335-1342. doi: 10.1111/1756-185X.13338. Int J Rheum Dis. 2018. PMID: 29968332 Review.
Cited by
-
MicroRNAs in rheumatoid arthritis.Clin Rheumatol. 2015 Apr;34(4):615-28. doi: 10.1007/s10067-015-2898-x. Epub 2015 Mar 4. Clin Rheumatol. 2015. PMID: 25736037 Review.
-
Circulating miRNAs and PD-L1 Tumor Expression Are Associated with Survival in Advanced NSCLC Patients Treated with Immunotherapy: a Prospective Study.Clin Cancer Res. 2019 Apr 1;25(7):2166-2173. doi: 10.1158/1078-0432.CCR-18-1981. Epub 2019 Jan 7. Clin Cancer Res. 2019. PMID: 30617131 Free PMC article.
-
Changes in MiRNA-5196 Expression as a Potential Biomarker of Anti-TNF-α Therapy in Rheumatoid Arthritis and Ankylosing Spondylitis Patients.Arch Immunol Ther Exp (Warsz). 2018 Oct;66(5):389-397. doi: 10.1007/s00005-018-0513-y. Epub 2018 May 9. Arch Immunol Ther Exp (Warsz). 2018. PMID: 29744553 Free PMC article.
-
MicroRNA-155 influences B-cell function through PU.1 in rheumatoid arthritis.Nat Commun. 2016 Sep 27;7:12970. doi: 10.1038/ncomms12970. Nat Commun. 2016. PMID: 27671860 Free PMC article.
-
miR-155 is involved in Alzheimer's disease by regulating T lymphocyte function.Front Aging Neurosci. 2015 Apr 30;7:61. doi: 10.3389/fnagi.2015.00061. eCollection 2015. Front Aging Neurosci. 2015. PMID: 25983691 Free PMC article. Review.
References
-
- Firestein GS. Evolving concepts of rheumatoid arthritis. Nature. 2003;423:356–361. - PubMed
-
- van Amelsfort JM, Jacobs KM, Bijlsma JW, Lafeber FP, Taams LS. CD4(+)CD25(+) regulatory T cells in rheumatoid arthritis: differences in the presence, phenotype, and function between peripheral blood and synovial fluid. Arthritis Rheum. 2004;50:2775–2785. - PubMed
Publication types
MeSH terms
Substances
LinkOut - more resources
Full Text Sources
Other Literature Sources
Medical
Molecular Biology Databases
Research Materials
