. 2014 Mar 15;306(6):C559-69.
doi: 10.1152/ajpcell.00375.2012. Epub 2014 Jan 8.

Protein kinase G increases antioxidant function in lung microvascular endothelial cells by inhibiting the c-Abl tyrosine kinase

Affiliations

Protein kinase G increases antioxidant function in lung microvascular endothelial cells by inhibiting the c-Abl tyrosine kinase

R Scott Stephens et al. Am J Physiol Cell Physiol. .

Abstract

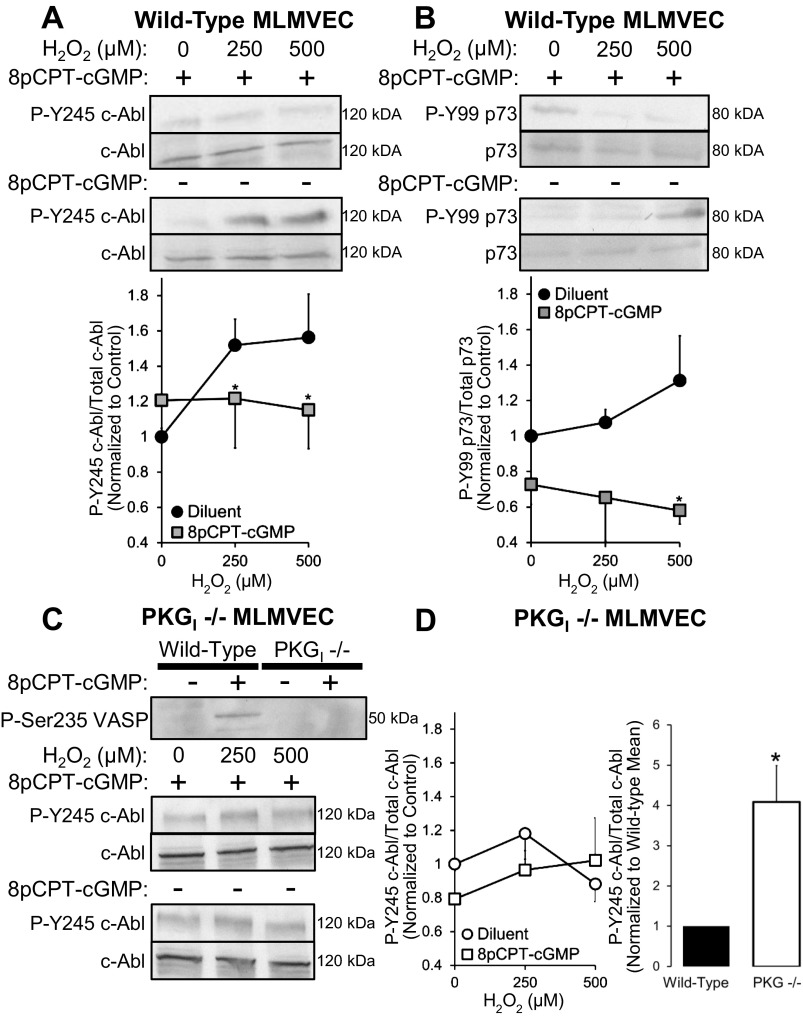
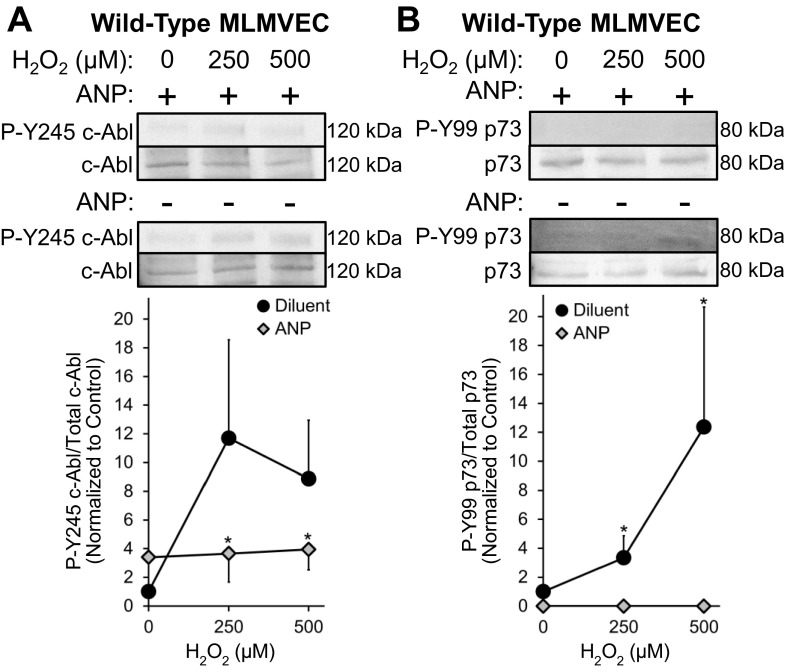
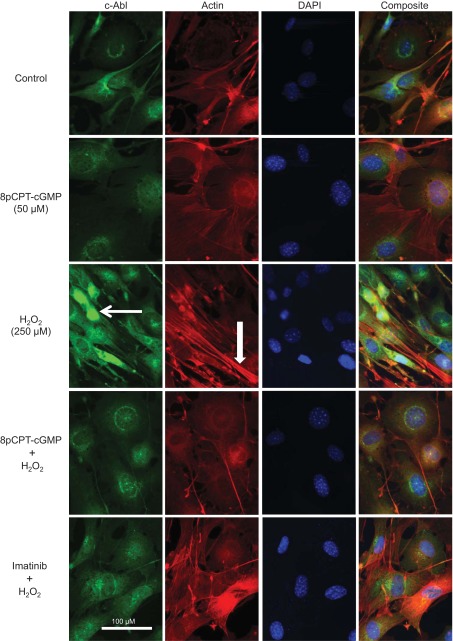
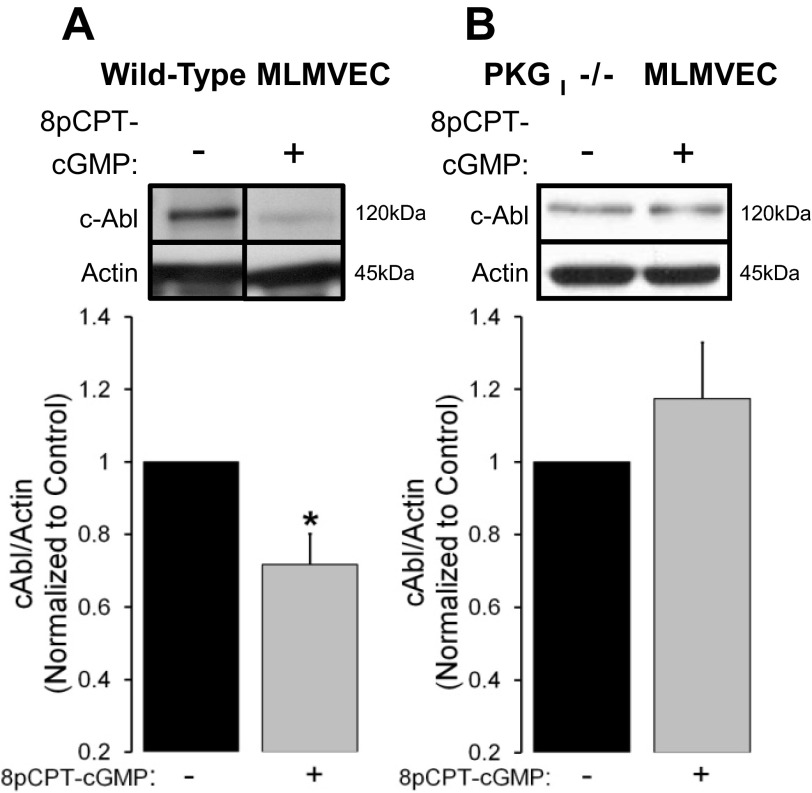
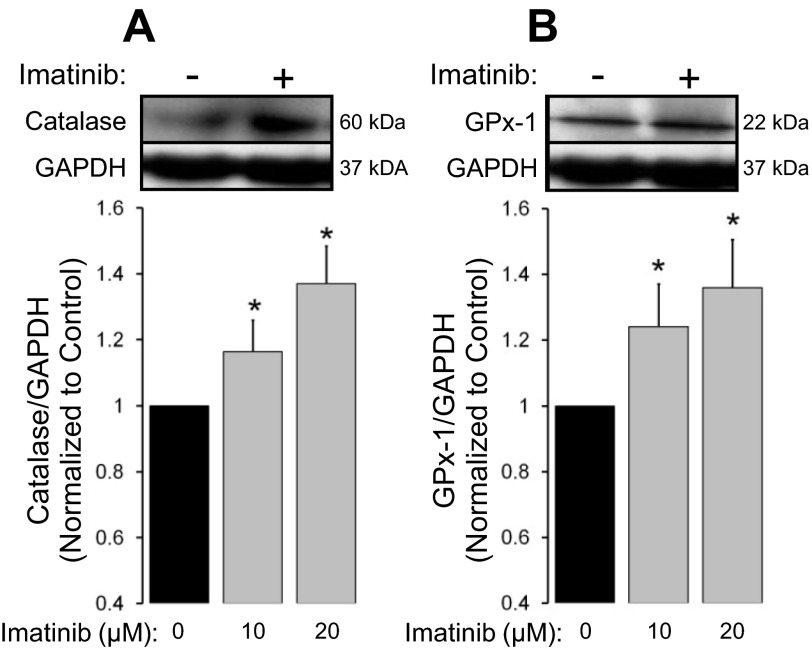
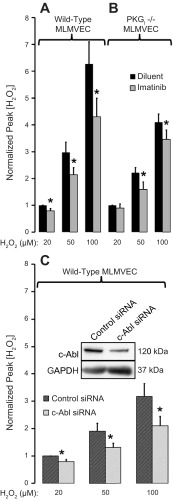
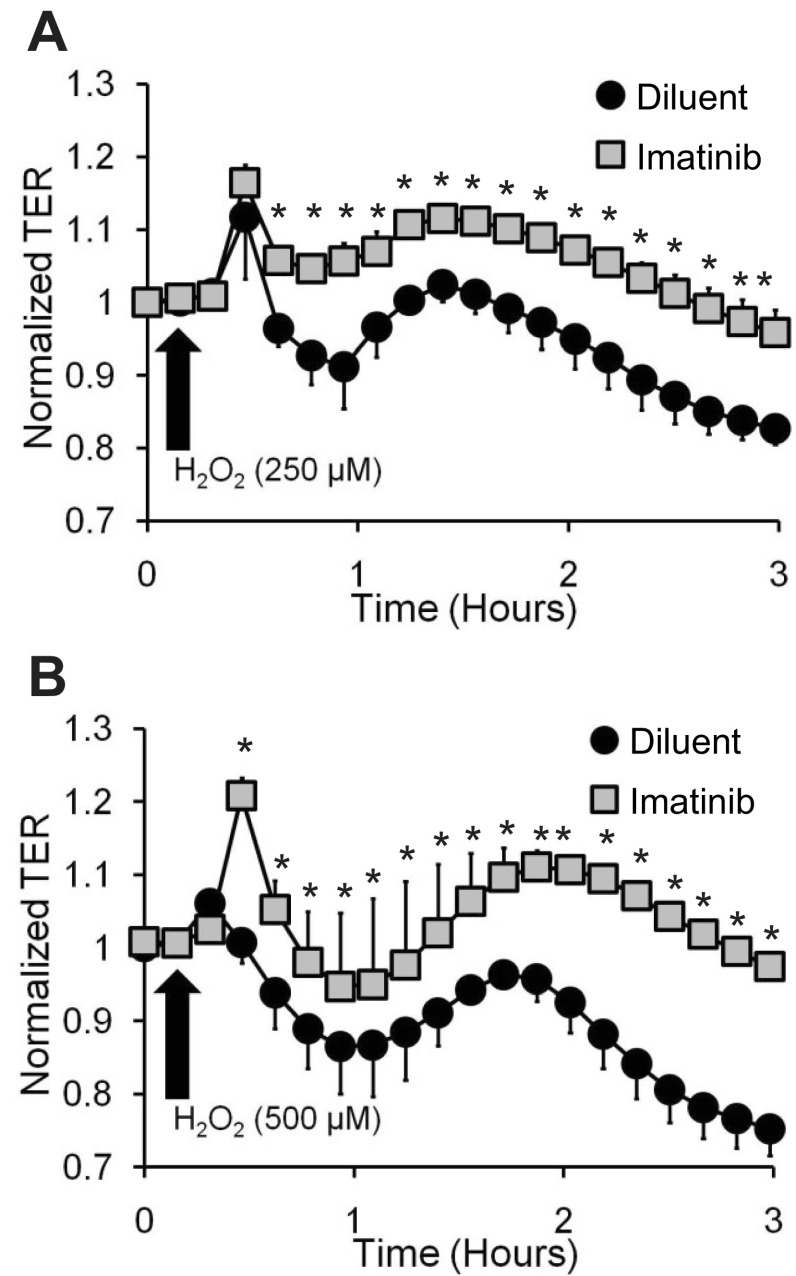
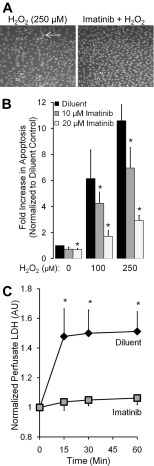
Oxidant injury contributes to acute lung injury (ALI). We previously reported that activation of protein kinase GI (PKGI) posttranscriptionally increased the key antioxidant enzymes catalase and glutathione peroxidase 1 (Gpx-1) and attenuated oxidant-induced cytotoxicity in mouse lung microvascular endothelial cells (MLMVEC). The present studies tested the hypothesis that the antioxidant effect of PKGI is mediated via inhibition of the c-Abl tyrosine kinase. We found that activation of PKGI with the cGMP analog 8pCPT-cGMP inhibited c-Abl activity and decreased c-Abl expression in wild-type but not PKGI(-/-) MLMVEC. Treatment of wild-type MLMVEC with atrial natriuretic peptide also inhibited c-Abl activation. Moreover, treatment of MLMVEC with the c-Abl inhibitor imatinib increased catalase and GPx-1 protein in a posttranscriptional fashion. In imatinib-treated MLMVEC, there was no additional effect of 8pCPT-cGMP on catalase or GPx-1. The imatinib-induced increase in antioxidant proteins was associated with an increase in extracellular H2O2 scavenging by MLMVEC, attenuation of oxidant-induced endothelial barrier dysfunction, and prevention of oxidant-induced endothelial cell death. Finally, in the isolated perfused lung, imatinib prevented oxidant-induced endothelial toxicity. We conclude that cGMP, through activation of PKGI, inhibits c-Abl, leading to increased key antioxidant enzymes and resistance to lung endothelial oxidant injury. Inhibition of c-Abl by active PKGI may be the downstream mechanism underlying PKGI-mediated antioxidant signaling. Tyrosine kinase inhibitors may represent a novel therapeutic approach in oxidant-induced ALI.

Keywords: acute lung injury; c-Abl; endothelium; oxidant injury; protein kinase G.


Figures

Fig. 1.
Fig. 1.
A: wild-type mouse lung microvascular endothelial cells (MLMVEC). Representative Western blot showing the effect of 0, 250, and 500 μM H2O2 on phospho-Y245 c-Abl and total c-Abl in the presence and absence of 8pCPT-cGMP. Graph shows effect of 30-min 8pCPT-cGMP (50 μM) on H2O2-induced c-Abl activation in wild-type MLMVEC, as measured by c-Abl Y245 phosphorylation, controlled for total c-Abl (n = 5; *P < 0.05, significant interaction by ANOVA). B: wild-type MLMVEC. Representative Western blot showing the effect of 0, 250, and 500 μM H2O2 on phospho-Y99 p73 and total p73 in the presence and absence of 8pCPT-cGMP. Graph shows effect of 30-min 8pCPT-cGMP (50 μM) on H2O2-induced p73 phosphorylation in wild-type MLMVEC, controlled for total p73 (n = 6; *P < 0.05 by ANOVA). C: protein kinase GI mice (PKGI−/−) MLMVEC. Representative Western blots showing phosphorylation of vasodilator-stimulated phosphoprotein (VASP) serine 235 after 8pCPT-cGMP treatment in wild-type but not PKGI−/− MLMVEC, and the effect of 0, 250, and 500 μM H2O2 on phospho-Y245 c-Abl and total c-Abl in the presence and absence of 8pCPT-cGMP. D, left: graph shows effect of 30-min 8pCPT-cGMP on H2O2-induced c-Abl activation in PKGI−/− MLMVEC (n = 4; P = not significant). Data are normalized to wild-type mean. D, right: graph shows baseline c-Abl activity, as measured by phospho-Y245 c-Abl/total c-Abl ratio in wild-type vs. PKGI−/− MLMVEC in the absence of 8pCPT-cGMP or H2O2 exposure (n = 9 and 4; *P < 0.01). All values are presented as means ± SE.
Fig. 2.
Fig. 2.
A: wild-type MLMVEC. Representative western blot showing the effect of 0, 250, and 500 μM H2O2 on phospho-Y245 c-Abl and total c-Abl in the presence and absence of atrial natriuretic peptide (ANP; 10 nM). Graph shows effect of 30-min ANP (10 nM) on H2O2-induced c-Abl activation in wild-type MLMVEC, as measured by c-Abl Y245 phosphorylation, controlled for total c-Abl (n = 7; *P < 0.05 by ANOVA). B: wild-type MLMVEC. Representative Western blots showing the effect of 0, 250, and 500 μM H2O2 on phospho-Y99 p73 and total p73 in the presence and absence of ANP. Graph shows effect of H2O2 on p73 phosphorylation, controlled for total p73 (n = 7; *P < 0.05 for effect of H2O2 in diluent-treated cells by ANOVA). The absence of phospho-p73 in ANP-treated cells (30 min, 10 nM) precluded quantification; signal represented as zero in graph.
Fig. 3.
Fig. 3.
Photomicrograph of wild-type MLMVEC shows effect of 8pCPT-cGMP (50 μM for 30 min), H2O2 (250 μM for 15 min), and imatinib (20 μM for 30 min) on cellular localization of c-Abl (green) and actin filaments (red) in MLMVEC. Nuclei labeled with DAPI (blue). Thin arrow: nuclear localization of c-Abl after H2O2-only treatment. Thick arrow: actin stress fibers present in H2O2-only treated cells. Images representative of 3 separate experiments. Photomicrographs at ×60 magnification.
Fig. 4.
Fig. 4.
A: representative Western blot of lysates from MLMVEC treated with 8pCPT-cGMP (50 μM) or diluent for 4 h. Blot probed for c-Abl and actin. Images are from different lanes of the same blot. Graph shows the effect of 8pCPT-cGMP on c-Abl protein in MLMVEC, controlled for actin and normalized to diluent control (n = 9). Values are means ± SE. *P < 0.05 vs. diluent control. B: representative Western blot of lysates from PKG−/− MLMVEC treated with 8pCPT-cGMP (50 μM) or diluent for 4 h. Blot probed for c-Abl and actin. Graph shows the effect of 8pCPT-cGMP on c-Abl protein in PKG −/− MLMVEC, controlled for actin and normalized to diluent control (n = 8; P = NS). Values are means ± SE.
Fig. 5.
Fig. 5.
A: effect of 4 h imatinib on catalase expression in MLMVEC. Western blot is representative of effect of 20 μM imatinib on catalase and GAPDH. Graph shows effect of 10 μM (n = 17) and 20 μM (n = 4) imatinib on catalase, controlled for GAPDH, and normalized to diluent control. Data are presented as means ± SE. *P < 0.05 vs. control. B: effect of 4-h imatinib on glutathione peroxidase 1 (Gpx-1) expression in MLMVEC. Western blot is representative of effect of 20 μM imatinib on GPx-1 and GAPDH. Graph shows effect of 10 μM (n = 17) and 20 μM (n = 4) imatinib on GPx-1, controlled for GAPDH and normalized to diluent control. Data are presented as means ± SE. *P < 0.05 vs. control.
Fig. 6.
Fig. 6.
A: Effect of 20 μM imatinib (n = 9) incubated for 4 h on the dose-response relationship between increasing added concentrations of H2O2 and the peak ΔpA normalized to the 20 μM H2O2 control value in wild-type MLMVEC (n = 9; *P < 0.05 by ANOVA). Values are means ± SE. B: effect of 20 μM imatinib (n = 5) on the dose-response relationship between increasing added concentrations of H2O2 and the peak ΔpA normalized to the 20 μM H2O2 control value in PKGI−/− MLMVEC (n = 5; *P < 0.05 by ANOVA). Values are means ± SE. C: representative Western blot shows effect of control small interfering (si)RNA and c-Abl siRNA on c-Abl protein levels in MLMVEC. GAPDH was used as a loading control. Graph shows effect of c-Abl siRNA and control siRNA on the dose-response relationship between increasing added concentrations of H2O2 and the peak ΔpA normalized to the 20 μM H2O2 control siRNA value in wild-type MLMVEC (n = 4; *P < 0.01 by ANOVA). Values are means ± SE.
Fig. 7.
Fig. 7.
Time course of transendothelial barrier resistance (TER) after 250 μM (A) and 500 μM H2O2 (B) in the presence and absence of imatinib (20 μM). Values normalized to immediately before H2O2 exposure (n = 4; *P < 0.05 by two-way ANOVA).
Fig. 8.
Fig. 8.
A: photomicrograph showing effect of diluent control and 20 μM imatinib (representative image, n = 5–7) on 250 μM H2O2 - induced apoptosis in MLMVEC. Staining is with Hoechst. White arrow indicates representative condensed, fragmented nuclei. B: effect of 10 and 20 μM imatinib (4 h) on 100 μM and 250 μM H2O2-induced apoptosis in MLMVEC, normalized to diluent, no H2O2 control (n = 5–7; *P < 0.05 by two-way ANOVA). C: effect of imatinib (1 μM) on the time course of perfusate lactate dehydrogenase (LDH) activity in isolated mouse lungs subjected to 60 min of hypoxic unventilated ischemia followed by 60 min of normoxic reperfusion (n = 3). AU, arbitrary units. Values are means ± SE. *P < 0.05 vs. control lungs by ANOVA.

Similar articles

Cited by

References

    1. Agami R, Blandino G, Oren M, Shaul Y. Interaction of c-Abl and p73alpha and their collaboration to induce apoptosis. Nature 399: 809–813, 1999 - PubMed
    1. Akashi N, Matsumoto I, Tanaka Y, Inoue A, Yamamoto K, Umeda N, Tanaka Y, Hayashi T, Goto D, Ito S, Sekiguchi K, Sumida T. Comparative suppressive effects of tyrosine kinase inhibitors imatinib and nilotinib in models of autoimmune arthritis. Mod Rheumatol 21: 267–275, 2011 - PubMed
    1. Aman J, van BJ, Damanafshan A, Huveneers S, Eringa EC, Vogel SM, Groeneveld AB, Vonk NA, van Hinsbergh VW, van Nieuw Amerongen GP. Effective treatment of edema and endothelial barrier dysfunction with imatinib. Circulation 126: 2728–2738, 2012 - PubMed
    1. Awazu M. Inhibition of platelet-derived growth factor receptor tyrosine kinase by atrial natriuretic peptide. Kidney Int 52: 356–362, 1997 - PubMed
    1. Brasher BB, Van Etten RA. c-Abl has high intrinsic tyrosine kinase activity that is stimulated by mutation of the Src homology 3 domain and by autophosphorylation at two distinct regulatory tyrosines. J Biol Chem 275: 35631–35637, 2000 - PubMed

Publication types

MeSH terms

LinkOut - more resources